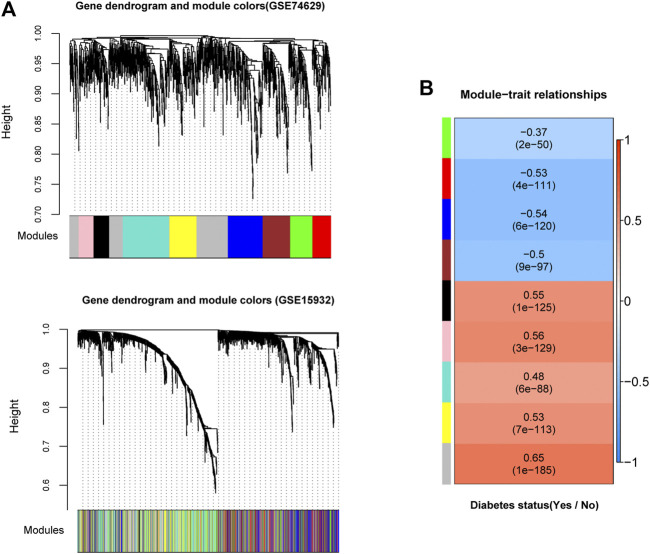
FIGURE 2.
Identification of significant gene modules by weighed gene co-expression network analysis (WGCNA) (A): The module partition in training and validation datasets (GSE74629 and GSE15932). Different colors represent different modules. For dataset GSE74629, nine gene modules (black, blue, brown, green, grey, pink, red, turquoise, and yellow modules) were identified to be associated with diabetes mellitus status (B): The heatmap of correlations between the nine modules extracted from GSE74629 with diabetes mellitus status. The color of left side means different modules, and the color of right side ranged from blue to red means the correlation coefficient ranged from −1 to 1.

