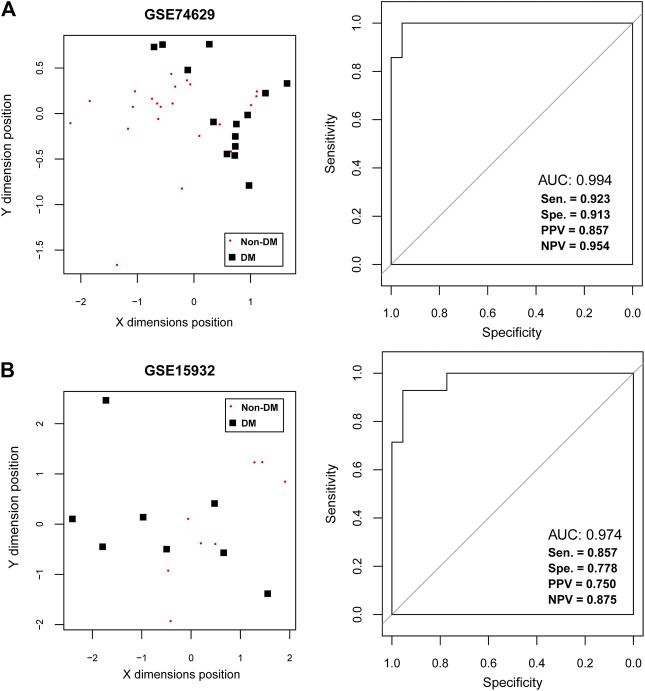
FIGURE 4.
The support vector machine (SVM) classification analysis (A) The SVM analysis in training dataset GSE74629. The left figure shows the scatter plot of SVM classification based on 21 feature genes and right figure indicates the receiver operating characteristic curve of SVM classifier. (B) The SVM analysis in training dataset GSE15932. The left figure shows the scatter plot of SVM classification based on 21 feature genes and right figure indicates the receiver operating characteristic curve of SVM classifier. The black square represents the diabetic samples and red node represents the non-diabetic samples.

