. 2021 May 21;41(4):E990–E1021. doi: 10.1148/rg.2021200125

Figure 1.

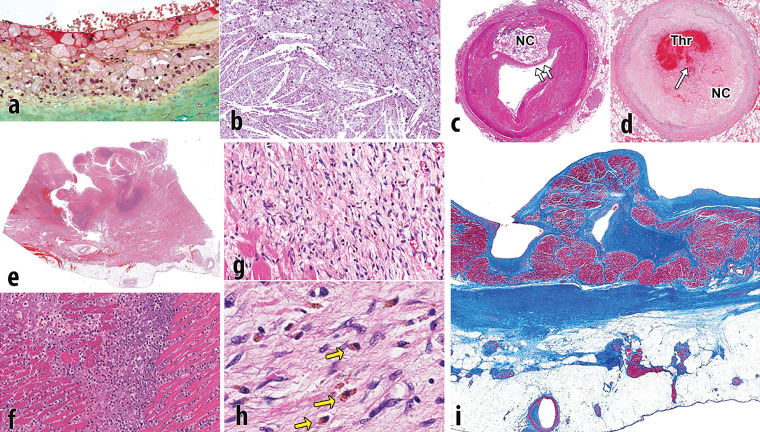
Pathophysiology of atherosclerotic plaque and MI. (a) Photomicrograph shows the surface of intimal plaque, with a luminal layer of foamy macrophages. The proteoglycan-rich fibrous portion of the plaque is depicted below (green area) (Movat pentachrome stain). (b) Photomicrograph shows the incipient necrotic core with foam cell macrophages (top right) that are degenerated with the release of free cholesterol from cell membranes forming crystals (bottom left). (c) Photomicrograph shows a fully developed necrotic core (NC), with thinning of the fibrous cap (arrows). (d) Photomicrograph shows an occlusive thrombus (Thr) within the arterial lumen, with a disrupted fibrous cap (arrow) overlying the necrotic core (NC). (e) Photomicrograph shows acute MI, transmural, with rupture. The rupture track is toward the left. The dark blue areas are degenerative neutrophils. (f) Photomicrograph shows a higher magnification of the blue areas in e that are fragmenting neutrophils. (g) Photomicrograph shows a healing infarct, with fibroblasts, early collagen strands, and abundant hemosiderin macrophages. (h) Photomicrograph shows hemosiderin macrophages (arrows) that were depicted at a lower resolution in g. (i) Photomicrograph shows a healed transmural infarct. This Masson trichrome stain demonstrates dense scar (blue area) from the endocardium (above) to the epicardium (below). There is some viable entrapped cardiac muscle near the endocardium (dark red area). Much of the fat near the epicardium is secondary to the infarct; fatty metaplasia is common in cardiac scars.

Pathophysiology of atherosclerotic plaque and MI. (a) Photomicrograph shows the surface of intimal plaque, with a luminal layer of foamy macrophages. The proteoglycan-rich fibrous portion of the plaque is depicted below (green area) (Movat pentachrome stain). (b) Photomicrograph shows the incipient necrotic core with foam cell macrophages (top right) that are degenerated with the release of free cholesterol from cell membranes forming crystals (bottom left). (c) Photomicrograph shows a fully developed necrotic core (NC), with thinning of the fibrous cap (arrows). (d) Photomicrograph shows an occlusive thrombus (Thr) within the arterial lumen, with a disrupted fibrous cap (arrow) overlying the necrotic core (NC). (e) Photomicrograph shows acute MI, transmural, with rupture. The rupture track is toward the left. The dark blue areas are degenerative neutrophils. (f) Photomicrograph shows a higher magnification of the blue areas in e that are fragmenting neutrophils. (g) Photomicrograph shows a healing infarct, with fibroblasts, early collagen strands, and abundant hemosiderin macrophages. (h) Photomicrograph shows hemosiderin macrophages (arrows) that were depicted at a lower resolution in g. (i) Photomicrograph shows a healed transmural infarct. This Masson trichrome stain demonstrates dense scar (blue area) from the endocardium (above) to the epicardium (below). There is some viable entrapped cardiac muscle near the endocardium (dark red area). Much of the fat near the epicardium is secondary to the infarct; fatty metaplasia is common in cardiac scars.