. 2021 May 21;41(4):E990–E1021. doi: 10.1148/rg.2021200125

Figure 7a.

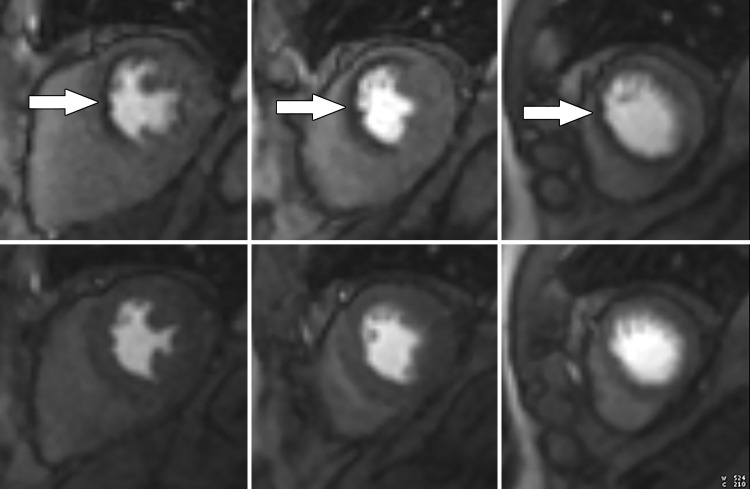
Abnormal ECG results in a 65-year-old man. (a) Short-axis adenosine stress perfusion cardiac MR images (top row) show a severe subendocardial perfusion defect in the LAD territory that becomes more transmural toward the apical segments (arrows). The rest perfusion images (bottom row) are normal. (b) Quantitative perfusion software automatically generates pixel maps that show myocardial perfusion in milliliters per gram per minute at stress (top row) and rest (bottom row) in this patient with an LAD coronary artery occlusion. Note that within the LAD territory, there is no significant change in perfusion (arrows) on the stress images when compared with the rest images, as both are less than about 1 mL/min/g (blue-green color range). This corresponds to the perfusion defect depicted on the raw MRI perfusion images. The normal myocardium reaches the orange color range during stress. (c) Polar maps, also automatically generated from the myocardial perfusion pixel maps, show myocardial blood flow during stress (left) and at rest (middle). The map on the right shows the myocardial perfusion reserve (MPR). All LAD segments have an abnormal MPR (abnormal =MPR <1.5), corresponding to the patient’s LAD coronary artery occlusion.

Abnormal ECG results in a 65-year-old man. (a) Short-axis adenosine stress perfusion cardiac MR images (top row) show a severe subendocardial perfusion defect in the LAD territory that becomes more transmural toward the apical segments (arrows). The rest perfusion images (bottom row) are normal. (b) Quantitative perfusion software automatically generates pixel maps that show myocardial perfusion in milliliters per gram per minute at stress (top row) and rest (bottom row) in this patient with an LAD coronary artery occlusion. Note that within the LAD territory, there is no significant change in perfusion (arrows) on the stress images when compared with the rest images, as both are less than about 1 mL/min/g (blue-green color range). This corresponds to the perfusion defect depicted on the raw MRI perfusion images. The normal myocardium reaches the orange color range during stress. (c) Polar maps, also automatically generated from the myocardial perfusion pixel maps, show myocardial blood flow during stress (left) and at rest (middle). The map on the right shows the myocardial perfusion reserve (MPR). All LAD segments have an abnormal MPR (abnormal =MPR <1.5), corresponding to the patient’s LAD coronary artery occlusion.