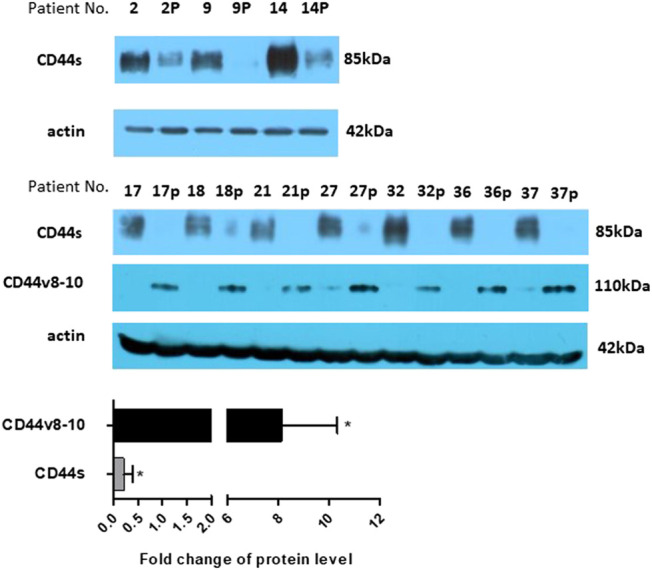
FIGURE 4.

Protein expression. Expression of CD44s was checked on several larger samples using western blotting. The level of CD44s expression significantly drops in polyp samples. The level of protein expression was also estimated using densitometric analysis and put on a bar graph, bottom panel. Expression of CD44v8-10 is presented by bands at around 110 kDa. Actin was used as a loading control. “p” behind the number indicates polyp tissue.
