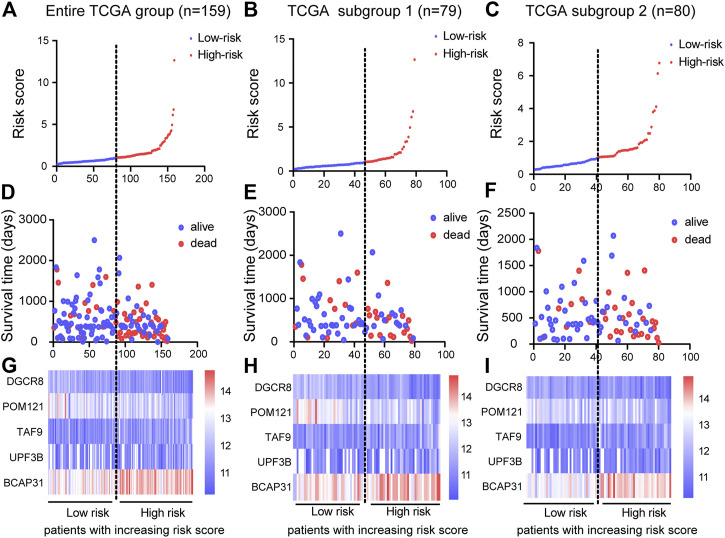
FIGURE 4.
Construction of prognostic risk score system and identification of five-gene prognostic model. Risk score distribution of five genes in three cohorts: entire TCGA group (n = 159), TCGA subgroup 1 (n = 79), and TCGA subgroup 2 (n = 80). Top (A)–(C) and middle (D)–(F) plots show patient survival time and status based on risk score system (G)–(I) Heatmap of expression of the five genes; color from blue to red illustrates a trend from low expression to high expression.

