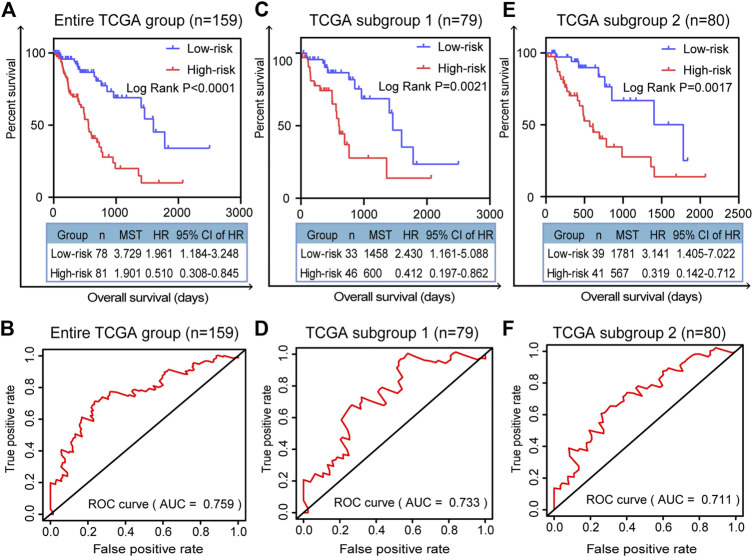
FIGURE 5.
Validation of prognostic signature for patients with ESCA. K–M survival curves for prognostic model and time-dependent ROC curve for (A, B) entire TCGA group (n = 159), (C, D) TCGA subgroup 1 (n = 79), and (E, F) TCGA subgroup 2 (n = 80). Two-sided log-rank and Wilcoxon p < 0.05 were considered significant. Abbreviation: MST, median survival time.

