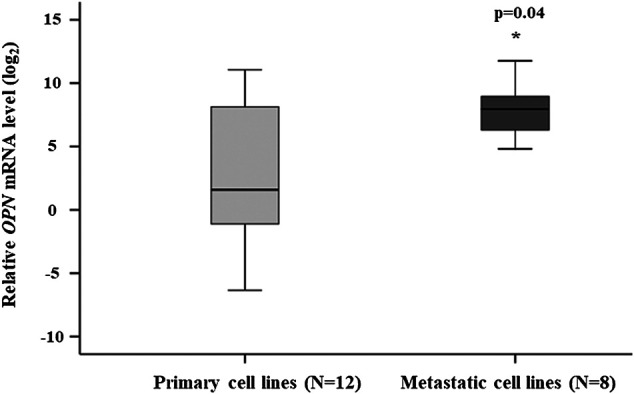
FIGURE 1.

Comparison of the relative OPN mRNA expression in the primary and metastatic cell lines. The data are presented as the mean ± SD of the primary (n = 12) and metastatic (n = 8) cell lines (three replicates/sample). Significant differences (p ≤ 0.05; Mann-Whitney test) are indicated by asterisks. Cell lines characteristics are summarized in Table 1.
