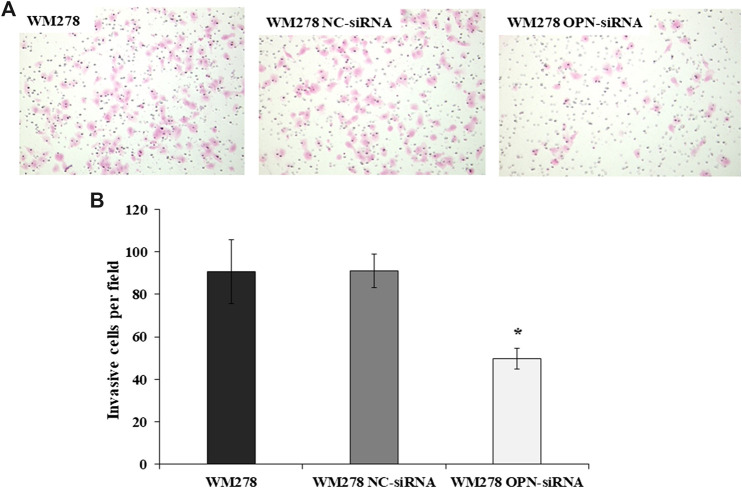
FIGURE 3.
Invasive potential of WM278 cells. (A) Cells were cultured in Matrigel invasion chambers, fixed and stained with hematoxylin–eosin (×100 magnification). (B) The number of invaded cells are plotted for the untreated, NC-siRNA treated and OPN-siRNA silenced cells. The data are presented as the mean ± SD of three independent experiments. Invasion was significantly lower in the silenced cells compared to the control cell lines (untreated WM278 and NC-siRNA treated WM278) (p ≤ 0.05; Student’s t-test). Asterisk indicates significant difference between the control and OPN silenced cell lines. Black column: untreated cells; gray column: Negative Control siRNA (NC-siRNA) transfected cells; white column: OPN-siRNA transfected cells).

