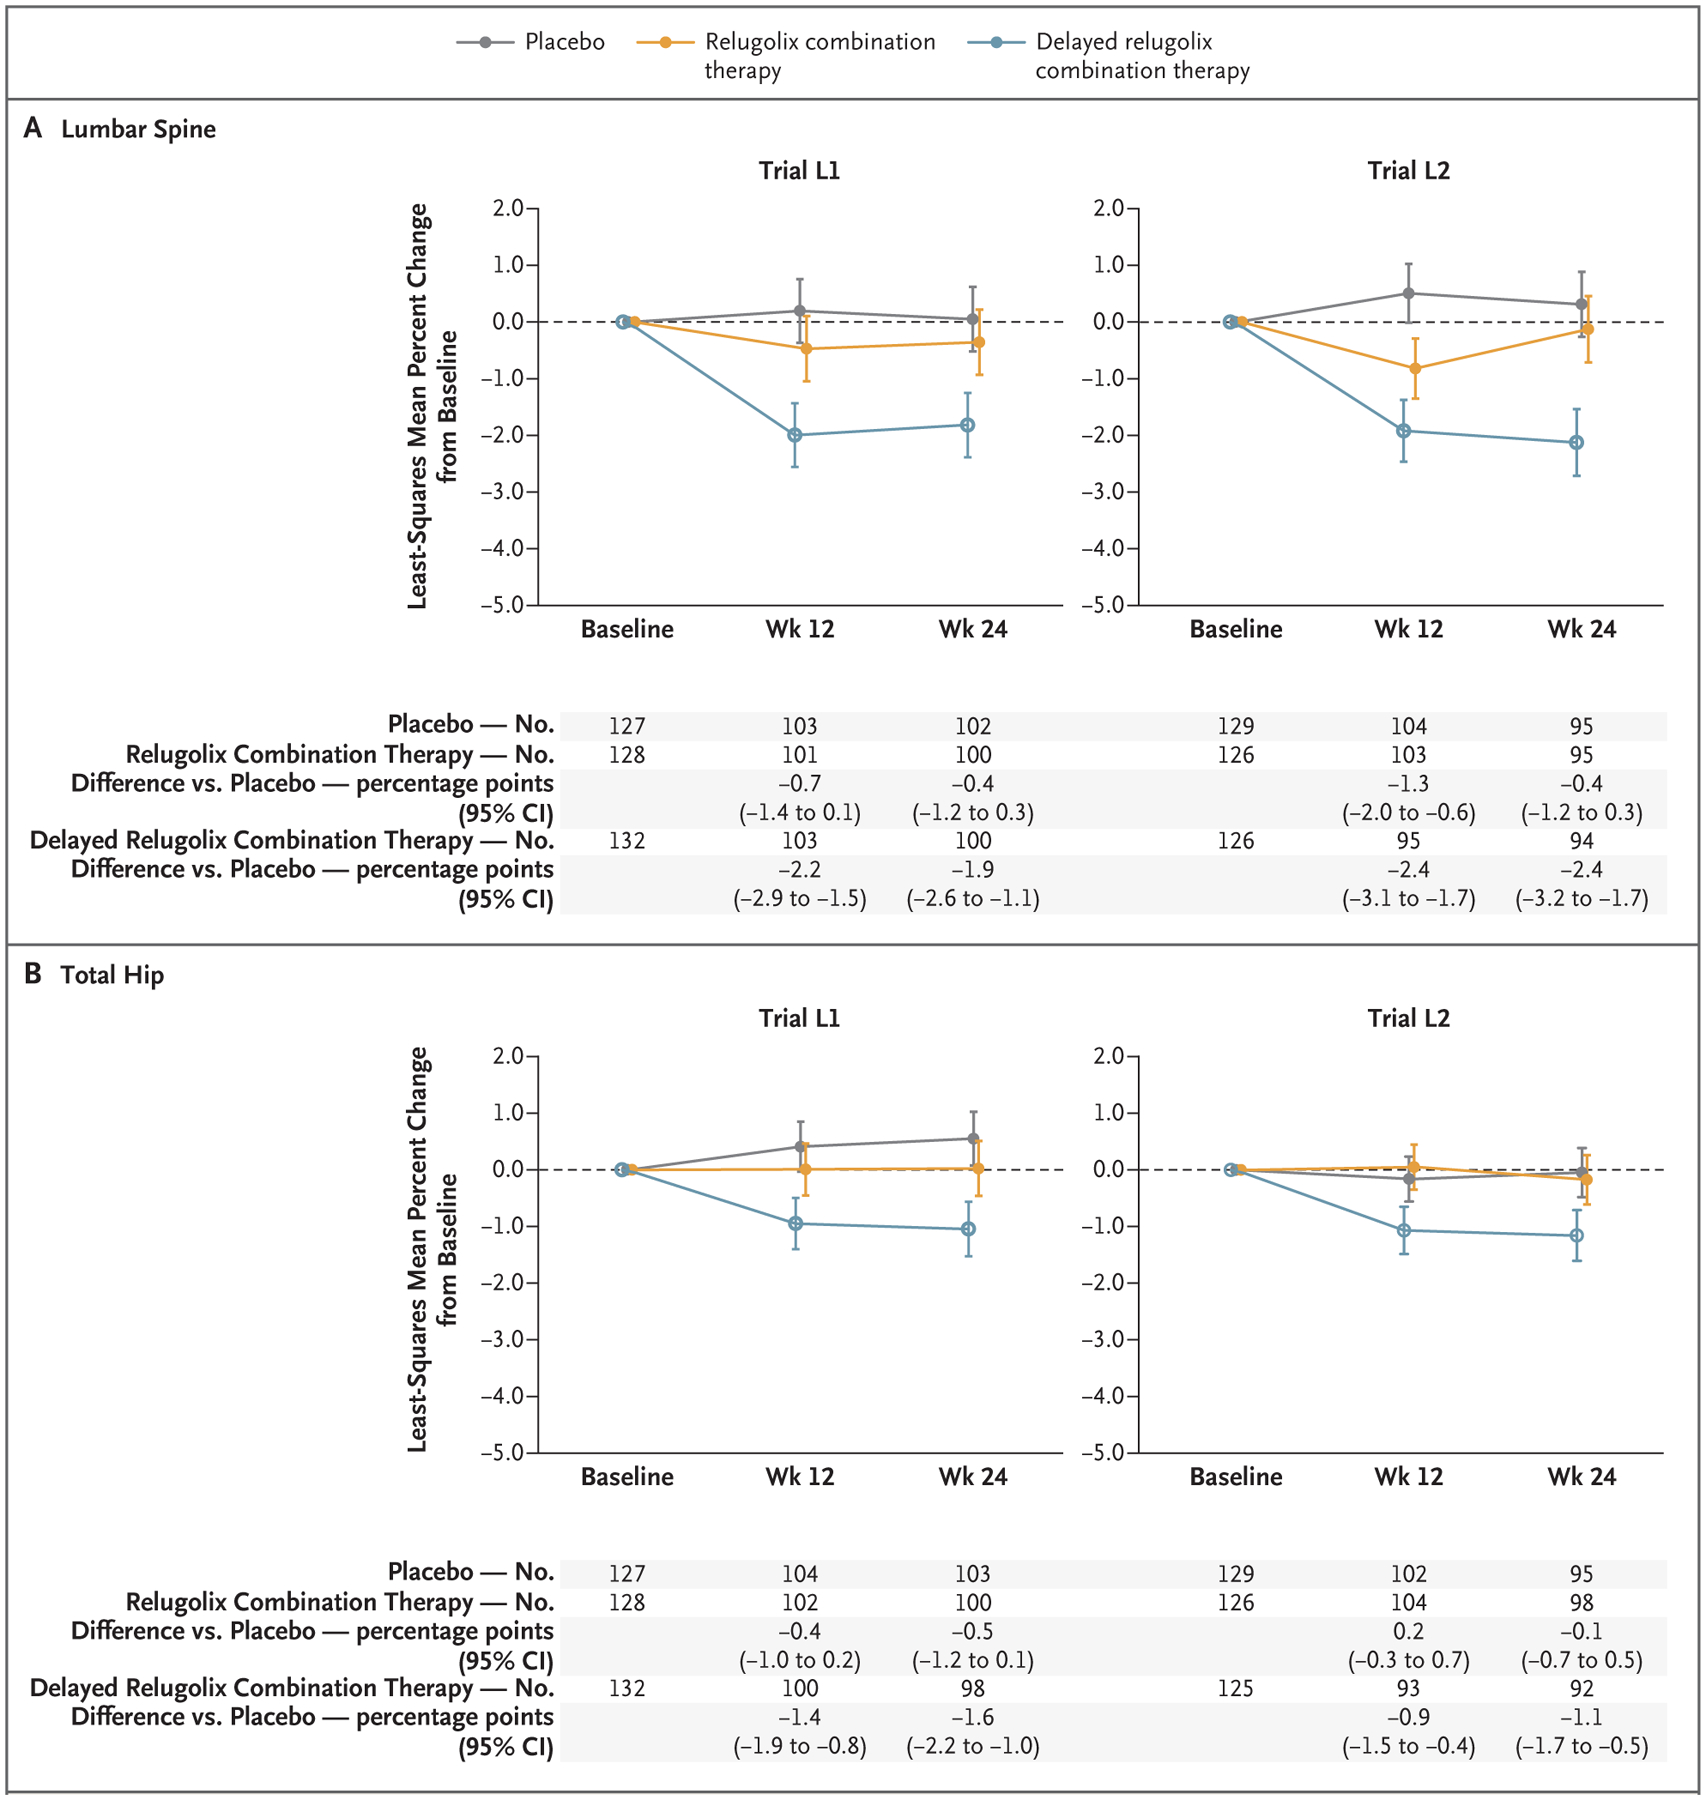
Figure 2. Change in Bone Mineral Density.

Least-squares means were based on mixed-effects models with baseline volume of menstrual blood loss, geographic region, age at baseline, body-mass index at baseline, bone mineral density at baseline, race, visit, and trial group–by–visit interaction as fixed effects. The dashed line indicates baseline, and the I bars 95% confidence intervals.
