
Figure 3:
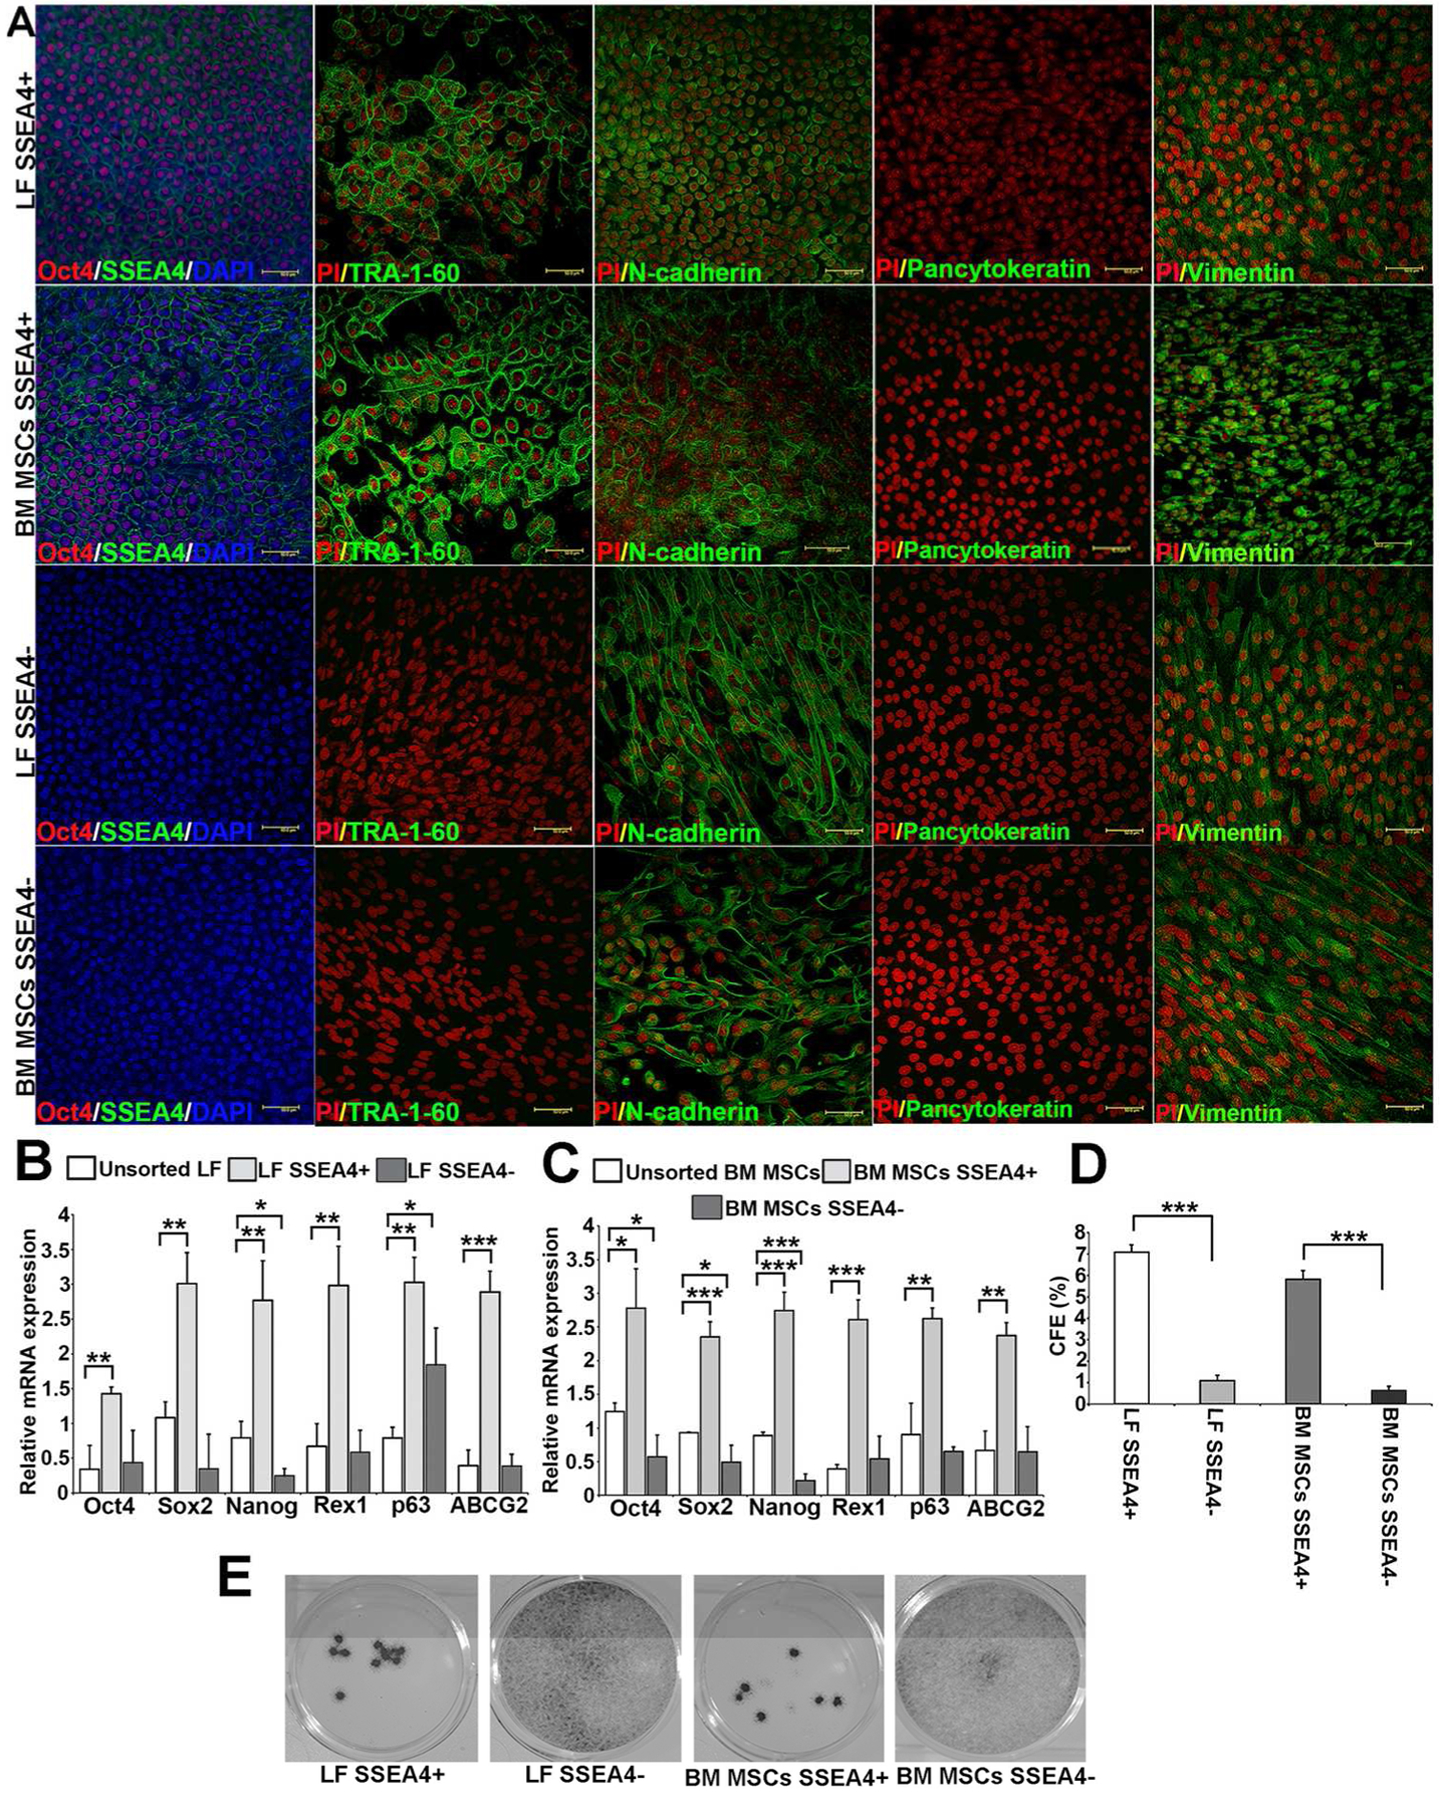
SSEA4+ cells of LFs and BM MSCs expressing stem cell markers. (A): LF and BM MSC SSEA4+ cells were both positive for SSEA4 (green), Oct4 (red), TRA-1-60 (green), N-cadherin (green), vimentin (green), and negative for epithelial marker Pancytokeratin (PCK). LF and BM MSCs SSEA4− cells were both negative for stem cell markers SSEA4, Oct4, TRA-1-60, and PCK, whereas they were positive for N-cadherin and vimentin. (B): qRT-PCR analysis of LFs in 3D Matrigel—unsorted LFs versus SSEA4+ and SSEA4− LFs. (C): qRT-PCR of BM MSCs in 3D Matrigel—unsorted BM MSCs versus SSEA4+ and SSEA4− cells. (D, E): Colony forming efficacy (CFE) of SSEA4 subgroups. A higher CFE was observed in SSEA4+ cells of both LFs and BM MSCs than in SSEA4− groups. The data represent the mean ± SEM from 6 experiments. Statistical analysis was performed using Two tailed Student’s t test (*p < 0.05, ** p < 0.01, *** p < 0.001). Abbreviations: LFs, limbal fibroblasts; BM MSCs, bone marrow mesenchymal stem cells; SSEA4, stage-specific embryonic antigen 4.