
Figure 6.
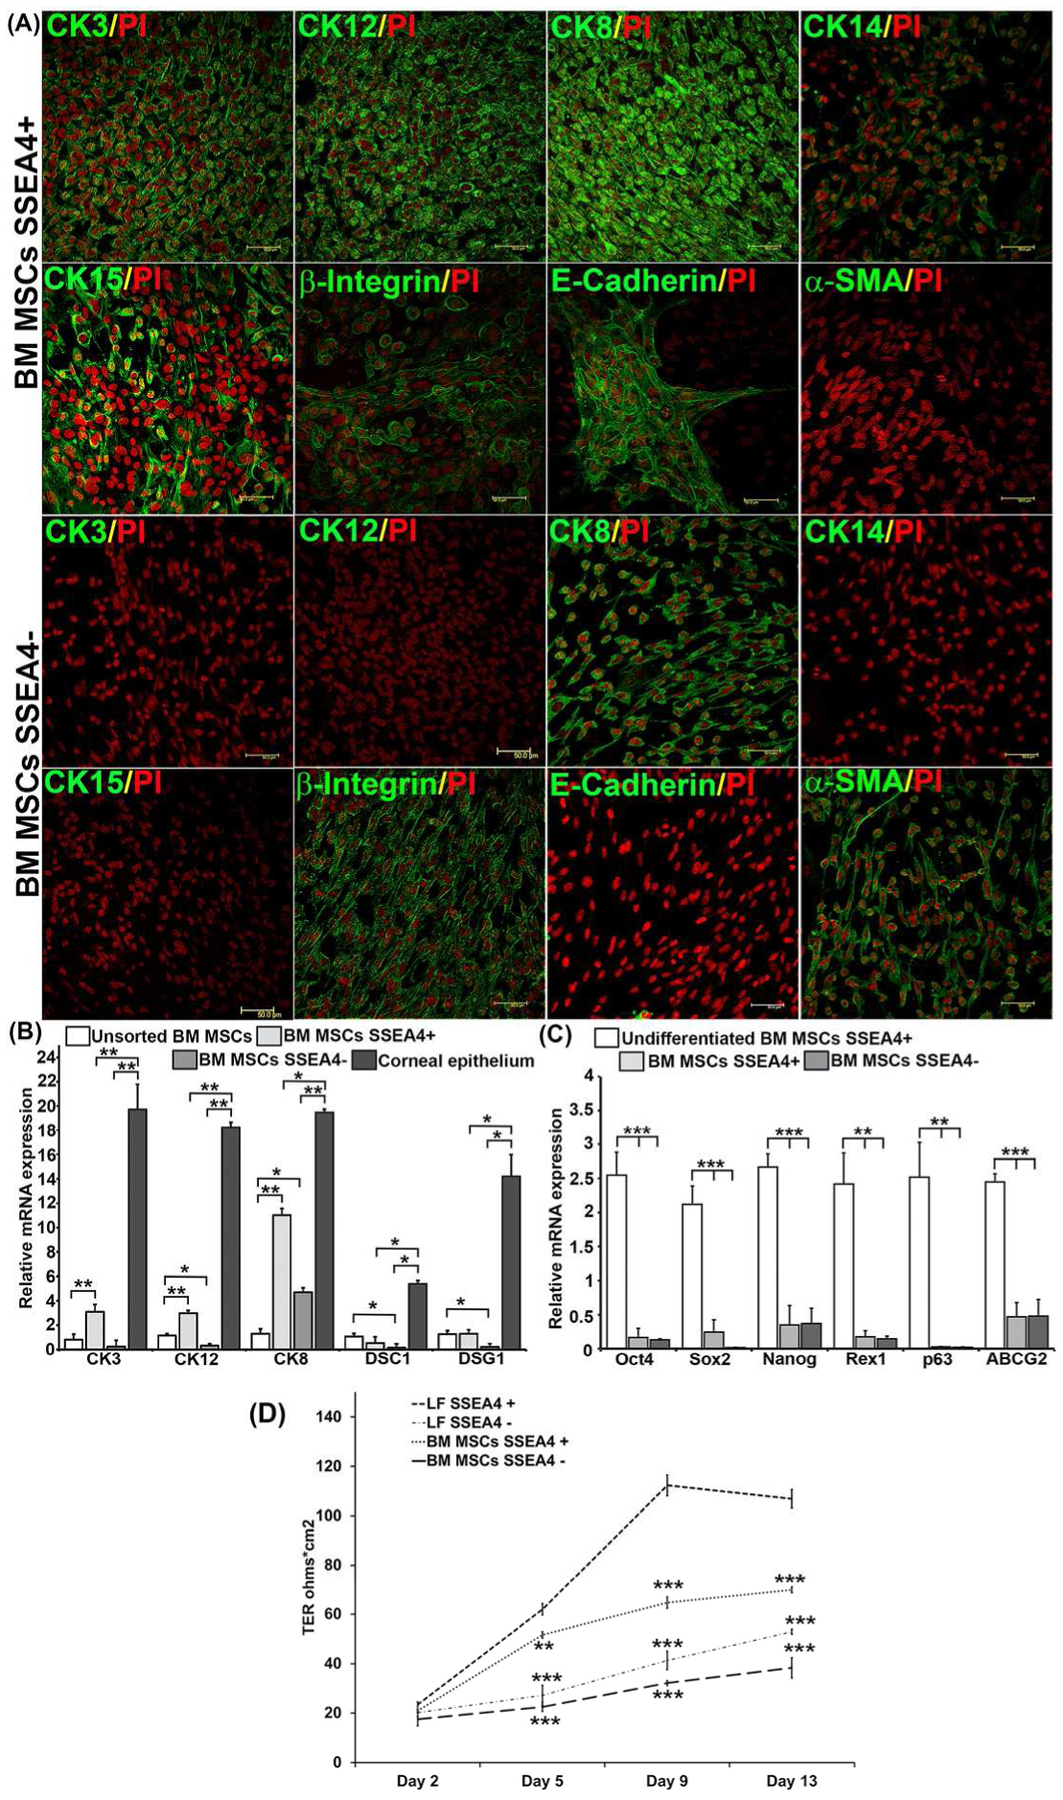
(A) Immunofluorescence of differentiated BM MSCs. Differentiated BM MSC SSEA4+ cells are positive for corneal epithelial markers CK3, CK12, CK8, CK14, CK15, β1 integrin, and E-cadherin, and negative for α-SMA. Differentiated BM MSC SSEA4− cells are negative for corneal epithelial markers CK3, CK12, CK14, CK15 and E+cadherin, and positive for CK8, β1 integrin, and α-SMA, Scale bar 50 μm. (B) RT-PCR of BM MSCs differentiated into corneal epithelial cells. (C) Expression of stem cell markers after differentiation in BM MSCs. The normalized gene expression-to-GAPDH ratio is shown on the y-axis. (D) After induction LF, BM MSCs SSEA4+ and SSEA4− cells were plated in 12-well transwell inserts (0.4 μm) at a density of 100,000 cells per transwell and transepithelial resistance (TER) was measured at day 2, 5, 9 and 13. LFs SSEA4+ were compared with LF SSEA4−, BM MSCs SSEA4+ and SSEA4− groups with one-way ANOVA. The data represent the mean ± SEM from 6 experiments. Statistical analysis was performed using Mann-Whitney U Test (B) and Two tailed Student’s t test (C), and one-way ANOVA (D) (*p < 0.05, ** p < 0.01, *** p < 0.001). Abbreviations: LFs, limbal fibroblasts; BM MSCs, bone marrow mesenchymal stem cells; SSEA4, stage-specific embryonic antigen 4; TER, transepithelial resistance; CK, cytokeratin.