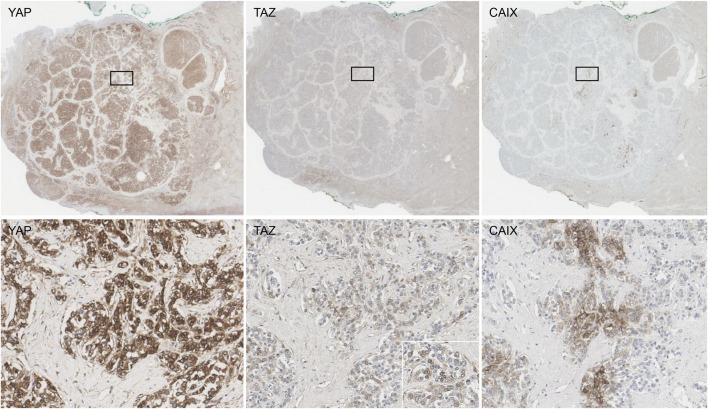
FIGURE 2.
The staining distribution of YAP, TAZ and CAIX in a whole tissue section of a hepatocellular carcinoma (upper row). YAP expression was strong in intensity and easily recognized at low power (left). TAZ expression was focal, but co-localized with YAP expression (middle). CAIX expression was strong in intensity and patchy, and were co-localized with YAP/TAZ expression in most cases (right). The boxed areas in the upper row are demonstrated at ×200 magnification in the lower row. The inset in the lower row is a ×400 magnification picture demonstrating the nuclear staining for TAZ.

