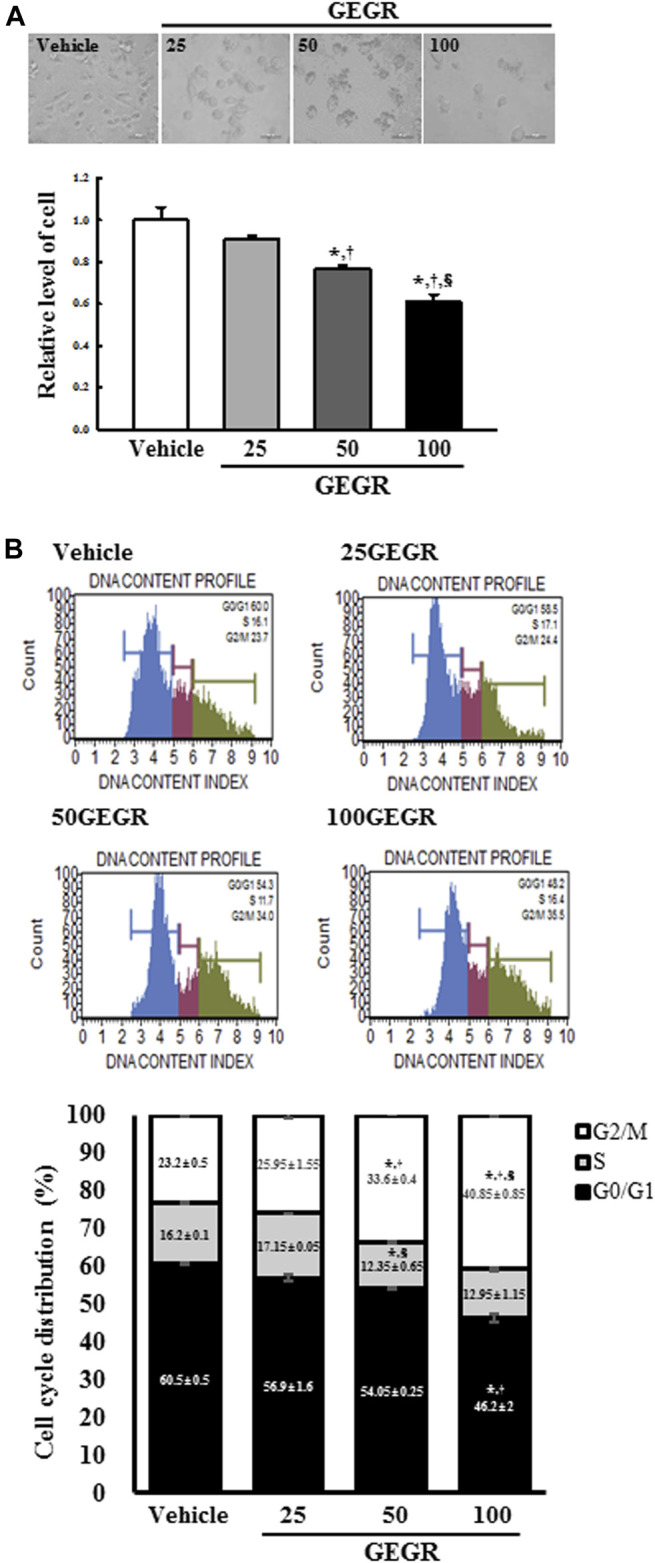
FIGURE 1.

Cytotoxicity and cell cycle analysis of GEGR treated LLC1 cells. (A) After incubation of LLC1 cells with 25, 50 and 100 μg/ml of GEGR for 24 h, the morphological changes of cells were observed under a microscope at 400 × magnification. Two to three wells per group were used in the MTT assay, and optical density was measured in duplicates. (B) After treatment with 25, 50 and 100 μg/ml of GEGR for 24 h, the number of LLC1 cells in the G0/G1, S and G2/M stages were analyzed. Two to three wells per group were used for PI staining, and the cell number in each phase was measured in duplicate. Data are reported as the means ± SD. *, p < 0.05 relative to the Vehicle treated group. †, p < 0.05 compared to the 25GEGR treated group. §, p < 0.05 compared to the 50GEGR treated group.
