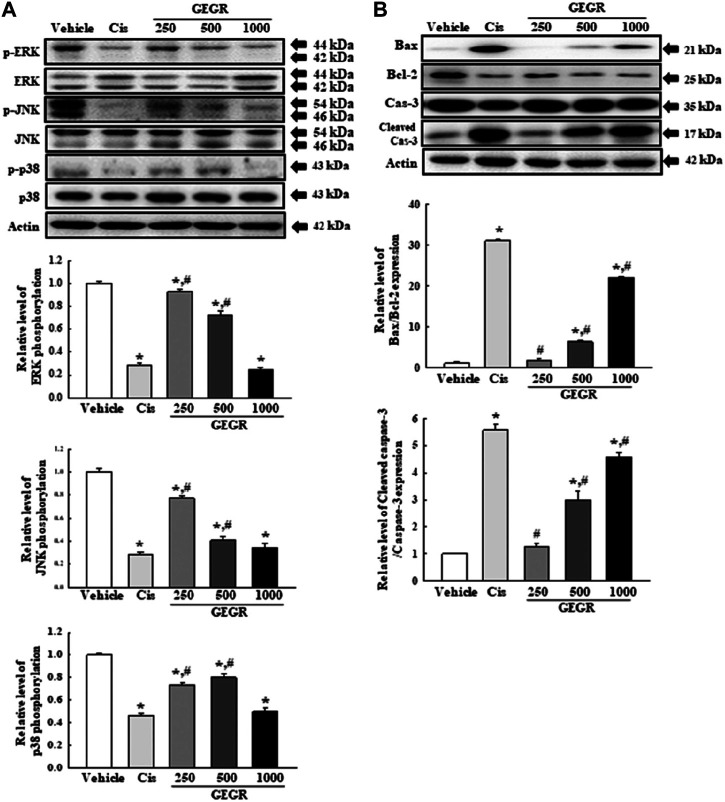
FIGURE 8.
Expression of the MAPK signaling pathway members (A) and apoptotic proteins (B) in LLC1 tumors of C57BL/6NKorl mice after treatment of 250, 500 and 1000GEGR. Expression levels of ten proteins were determined using an imaging densitometer. The level of each protein is presented relative to the intensity of actin. Two to three tumors per group were used in the preparation of the tumor homogenate, and Western blot analysis was assayed in duplicate for each sample. Data are reported as the means ± SD. *, p < 0.05 compared to the Vehicle treated group. #, p < 0.05 compared to the Cis treated group. #, p < 0.05 compared to the Cis treated group. †, p < 0.05 compared to the 250GEGR treated group. §, p < 0.05 compared to the 500GEGR treated group.

