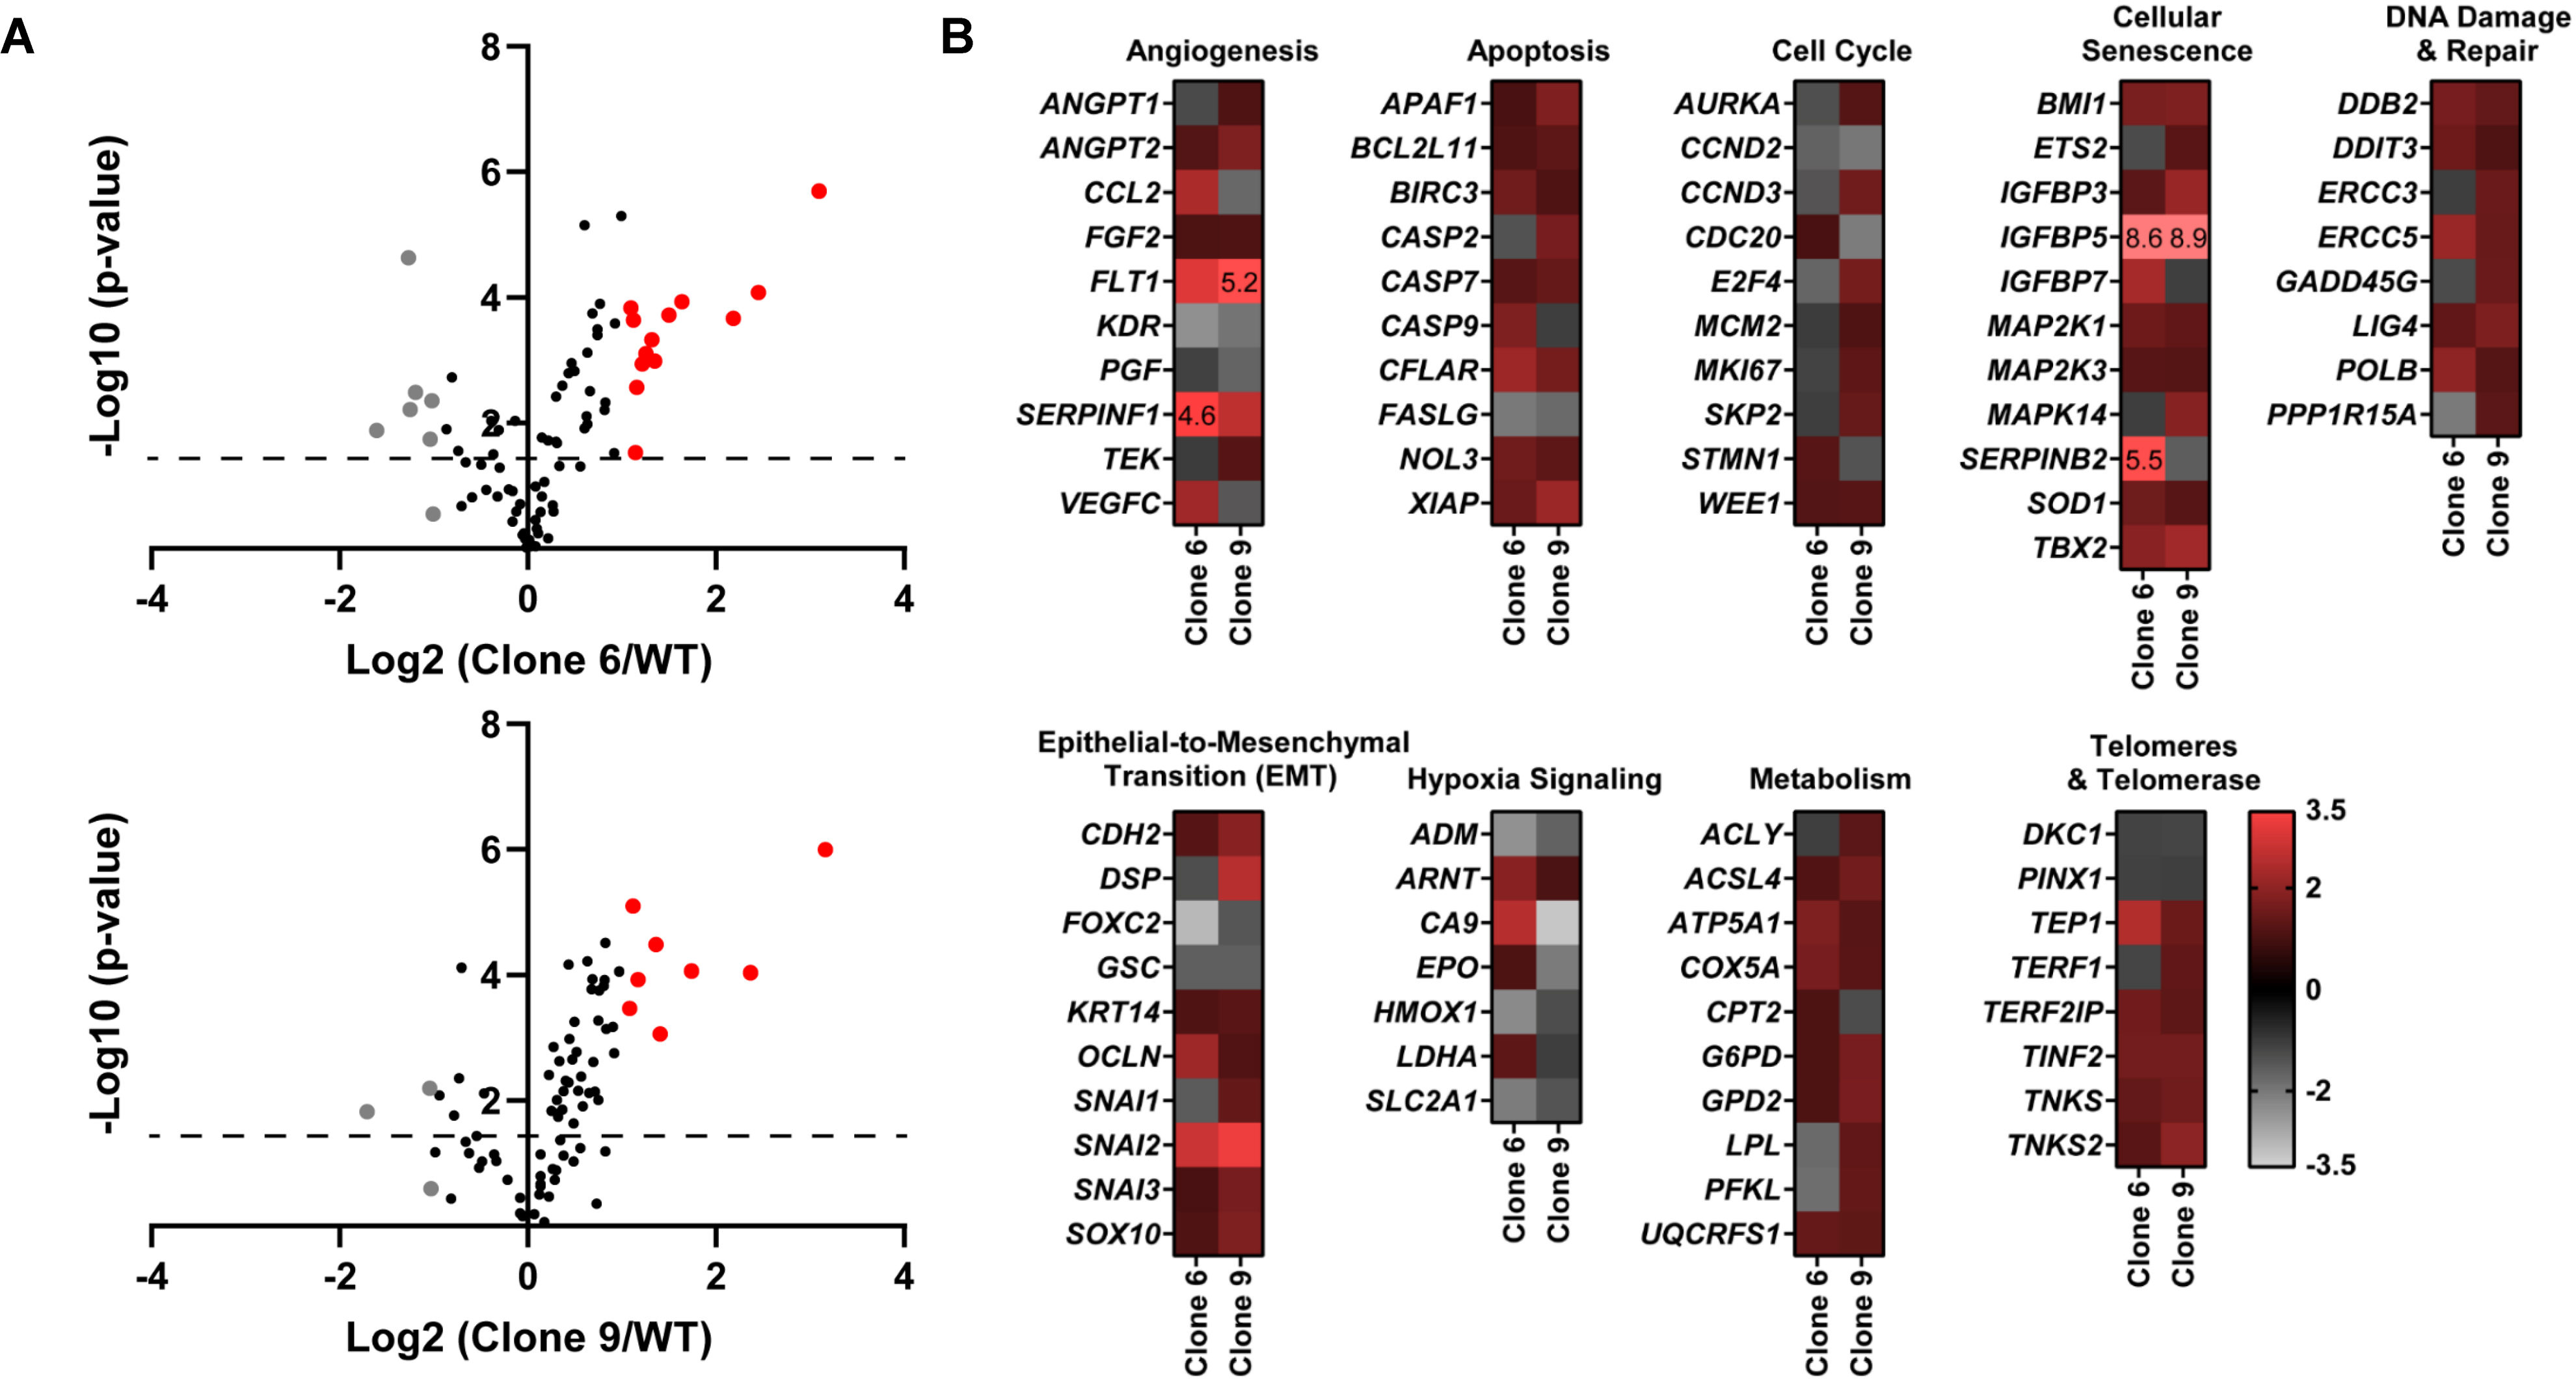
Figure 2.

CRISPR/Cas9-mediated SIRT6 knockout causes alterations in multiple cancer-associated pathways. Qiagen Human Cancer PathwayFinder RT2 Profiler PCR Array was performed using A375 WT and SIRT6 KO cells (clones #6 and 9). (A) Volcano plots outlining the distribution of 84 tested genes within the Qiagen Human Cancer PathwayFinder RT2 Profiler PCR Array are displayed. Data was graphed log2 (ratio) of SIRT6 KO clone 6 (left) or SIRT6 KO clone 9 (right) vs WT against the -Log10 (p-value). Upregulated genes that reached the 2-fold cut-off are shown in red whereas the downregulated are depicted in grey, and black if no/negligible fold change was observed. The dashed line indicates the 0.05 p-value cut off. (B) Heat maps of each SIRT6 KO clone vs WT were generated to display gene fold changes classified by the cancer pathway identified in the array. Upregulated genes are shown in red whereas the downregulated are depicted in grey. To view clear differences in gene expression, the scale covers fold regulation of −3.5 (grey) to 3.5 (red). Gene expression values falling outside of this scale are indicated by the indicated fold change value in the relevant box.
