. 2021 Mar 26;1(4):176–191. doi: 10.1039/d1ea00003a

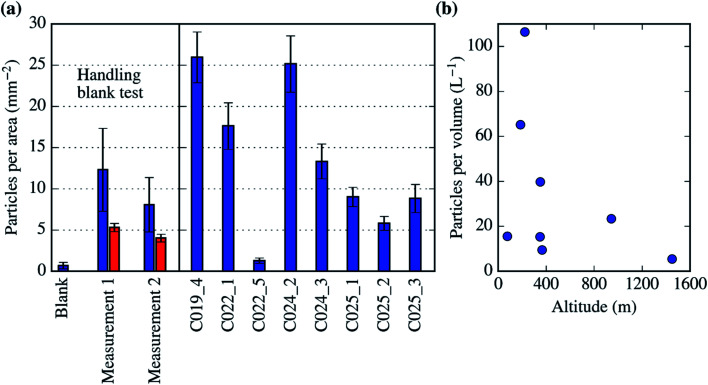
Fig. 10. Estimation of the concentrations of biological aerosol particles. (a) Biological particle concentration per unit of area in the filter. The first 3 bars correspond to the handling blank test carried out on the 27th of September of 2017. In this test, a handling blank as well as two samples were collected (measurement 1 and 2). The number of biological aerosol particles on top of the measurements was much higher than in the handling blank. The data in the red bar corresponds to a second analysis using a very low magnification, which underestimates the detection of biological aerosol particles. (b) Atmospheric concentrations of biological aerosol particles of the SEM-EDS analysed filters (from C019_4 to C025_3). The data has been presented alongside pressure altitude. Note that the data point in the bottom right side of the image (about 1500 m) corresponds to the low biological aerosol sample (C022_5).

Fig. 10