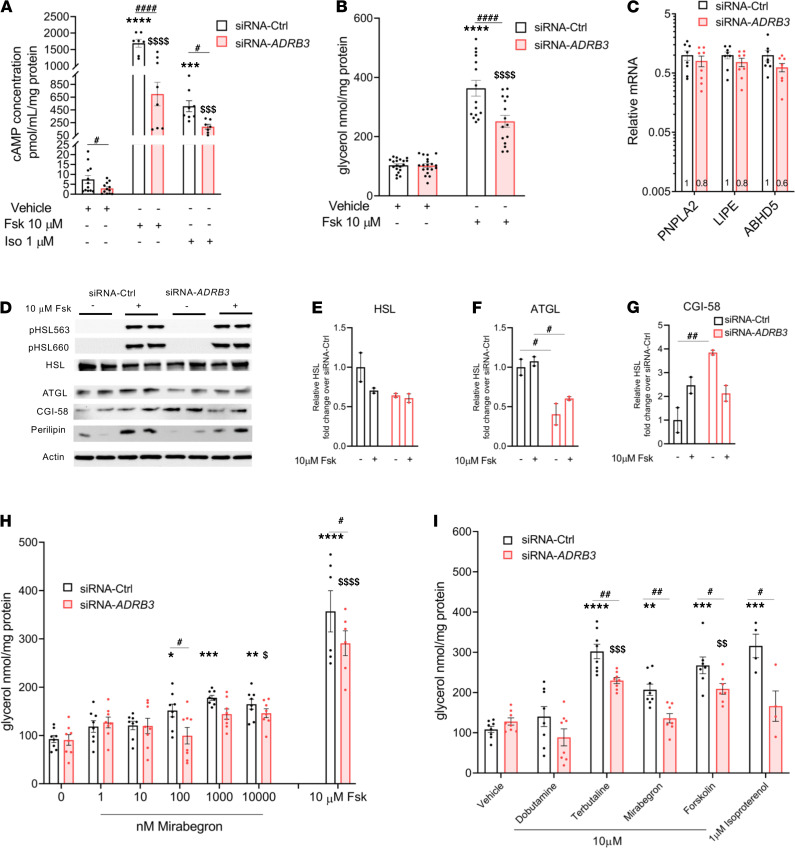
Figure 2. Silencing ADRB3 in human brown/beige adipocytes lowers cAMP and affects β-AR–stimulated lipolysis.
(A and B) Basal, forskolin-stimulated (Fsk 10 μM) and isoproterenol-stimulated (Iso 1 μM), cAMP concentration (A) and glycerol release (B) in siRNA-Ctrl and siRNA-ADRB3 adipocytes. (C) RNA levels of lipolytic genes PNPLA2, LIPE, and ABHD5 in siRNA-Ctrl and siRNA-ADRB3 adipocytes. (D) Protein expression of pHSL563, pHSL660, HSL, ATGL, CGI-58, perilipin, and actin in cell lysates following Fsk treatment. (E–G) Quantification of HSL (E), ATGL (F), and CGI-58 (G) from Western blotting analysis. (H) Glycerol released into the incubation media following dose-dependent treatment with mirabegron (1-10-100-1000-10,000 nM) in siRNA-Ctrl– and siRNA-ADRB3–transfected adipocytes. (I) Glycerol released by siRNA-Ctrl and siRNA-ADRB3 adipocytes treated with 10 μM of relatively selective human β1 agonist dobutamine, β2 agonist terbutaline, and β3 agonist mirabegron. Fsk (10 μM) and Iso (1 μM) were used as positive controls of agonist-induced lipolysis. Data are represented as mean ± SEM. Two-tailed unpaired Student’s t test and a 2-way ANOVA were used for statistical analysis. Gene expression data are normalized to siRNA-Ctrl adipocytes and expressed on a log10 scale. For cAMP and lipolysis data, *when comparing basal with stimulated in siRNA-Ctrl, $when comparing basal with stimulated in siRNA-ADRB3 adipocytes, #when comparing same doses between siRNA-Ctrl and siRNA-ADRB3 adipocytes. *,$,#P < 0.05; **,$$,##P < 0.01; ***,$$$P < 0.001; ****,$$$$,####P < 0.0001.

