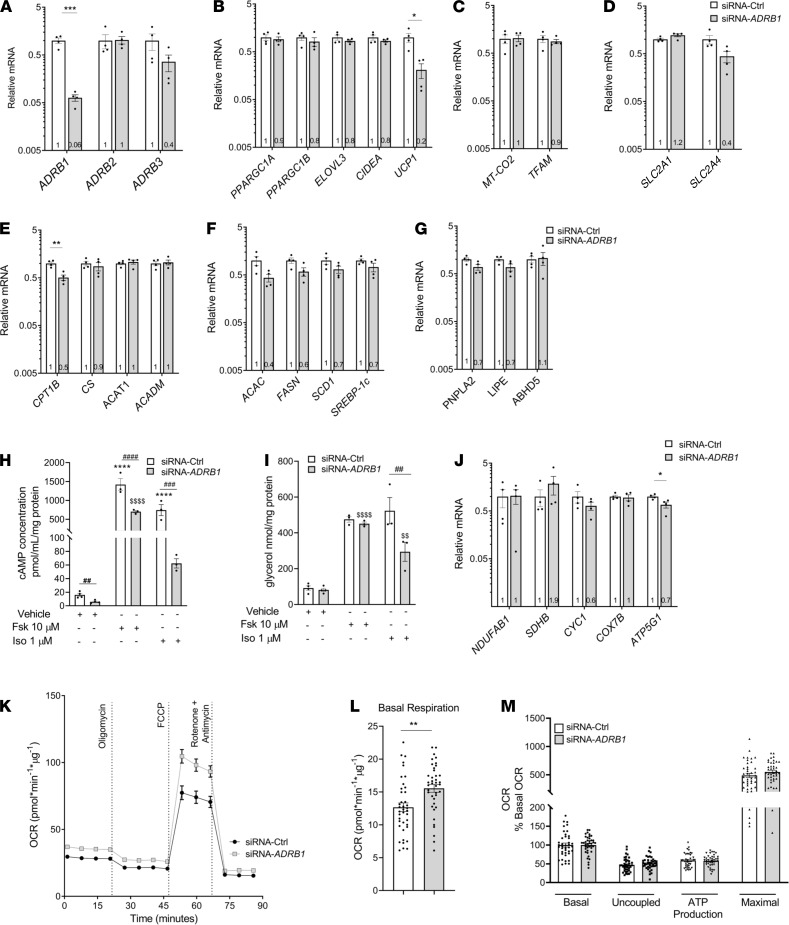
Figure 5. Silencing ADRB1 in primary brown/beige adipocytes decreases UCP1 expression but does not decrease lipolysis or cellular respiration.
(A–G) The mRNA expression profiles of β-ARs (A), thermogenic related genes (B), mtDNA-encoded genes (C), glucose transporters (D), fatty acid oxidation genes (E), fatty acid synthesis genes (F), and lipolytic genes PNPLA2, LIPE, and ABHD5 (G) in siRNA-Ctrl and siRNA-ADRB1 adipocytes after 48 hours of transfection. (H and I) Fsk-stimulated (10 μM) and Iso-stimulated (1 μM) cAMP (H) and glycerol release (I) in siRNA-Ctrl and siRNA-ADRB1 adipocytes. (J) RNA levels of nuclear encoded ETC genes in siRNA-Ctrl and siRNA-ADRB1 adipocytes. (K–M) OCR trace (K) and quantification of basal respiration (L) and respiratory profile (M) by differentiated siRNA-Ctrl– and siRNA-ADRB1–transfected adipocytes. Data are represented as mean ± SEM. Two-tailed unpaired Student’s t test and a 2-way ANOVA were used for statistical analysis. Gene expression data are normalized to siRNA-Ctrl adipocytes and expressed on a log10 scale. For cAMP and lipolysis data *when comparing basal with stimulated in siRNA-Ctrl, $when comparing basal with stimulated in siRNA-ADRB1 adipocytes, #when comparing same doses between siRNA-Ctrl and siRNA-ADRB1 adipocytes. *P < 0.05; **,$$,##P < 0.01; ***,###P < 0.001; ****,$$$$,####P < 0.0001.

