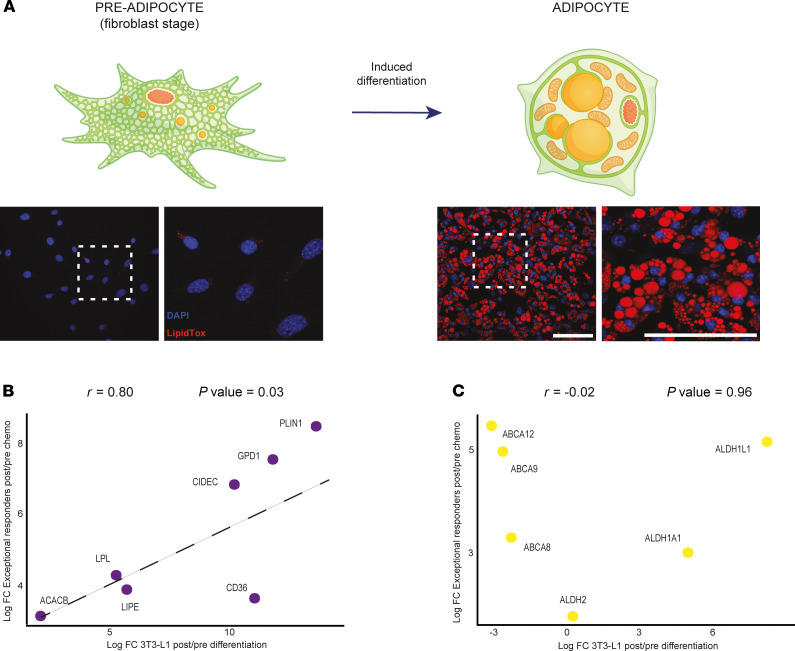
Figure 4. The transcriptome of MRD cells resembles differentiated adipocytes.
(A) Diagram in the upper panel represents the differentiation of 3T3-L1 cells into adipocytes. In the lower panel, fluorescence images with LipidTox staining show lipid droplets’ accumulation upon differentiation. Scale bars: 100 μm. (B) Scatterplot shows a positive correlation for lipid metabolism genes between the log2 fold change (log2FC) observed in the exceptional responders (post/pre chemo) and the log2FC in the 3T3-L1 differentiation experiment (post/pre expression ratios). (C) Scatterplot shows absence of correlation for ABC transporters and TIC genes between the log2FC observed in the exceptional responders (post/pre chemo) and the log2FC in the 3T3-L1 differentiation experiment (post/pre expression ratios).

