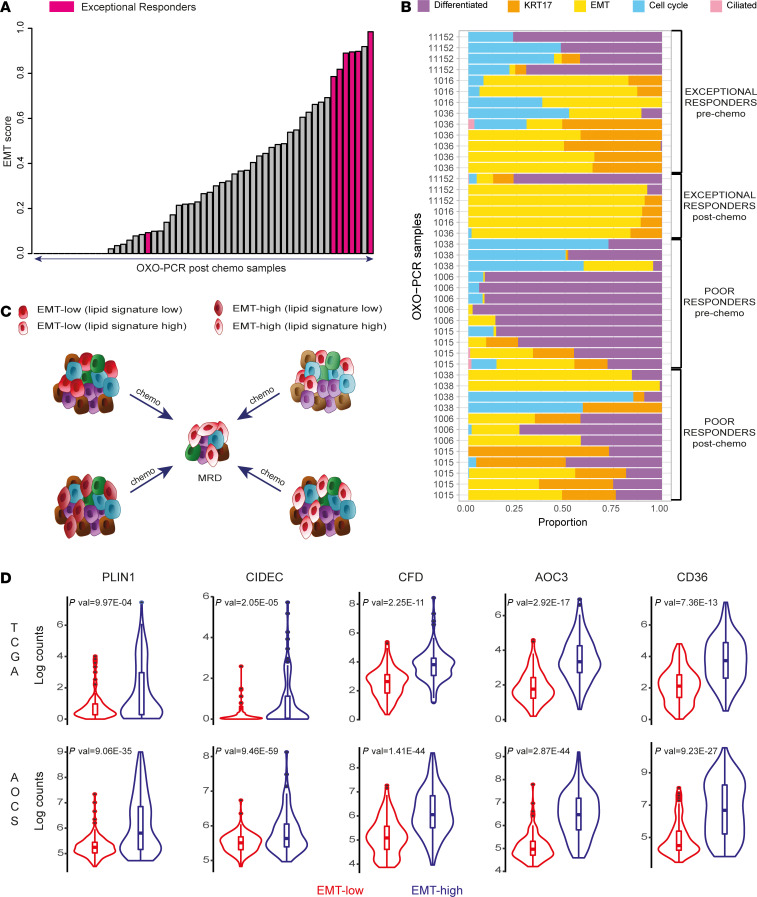
Figure 5. HGSOC MRD cells display EMT features.
(A) Bar plot shows the EMT score of all the postchemo OXO-PCR samples calculated using our deconvolution-based classifier (Methods). (B) Stacked bar plot visualizes the deconvolution result of 44 bulk and LCM tumor samples collected from 6 patients (3 poor responders and 3 exceptional responders). Colors of the bars denote the 5 cell states as shown in the legend. (C) The diagram presents alternative models to explain the adipocyte-like state observed in MRD. The lipid metabolism signature could be selected upon treatment (top left, bottom right), with either the coexistence of lipid-high and EMT-high phenotypes in the same cells (bottom right) or not (top left) before chemotherapy. Alternatively, the adipocyte-like state may be induced by chemotherapy (top right, bottom left), and the EMT features may be already present before treatment (top right) or not (bottom left) before chemotherapy. The different colors are used to represent tumor heterogeneity and possible clonal populations. (D) Violin plots show the expression levels of lipid metabolism genes in the EMT-high samples compared with the EMT-low ones across the TCGA and AOCS data sets (P values were computed by limma voom).

