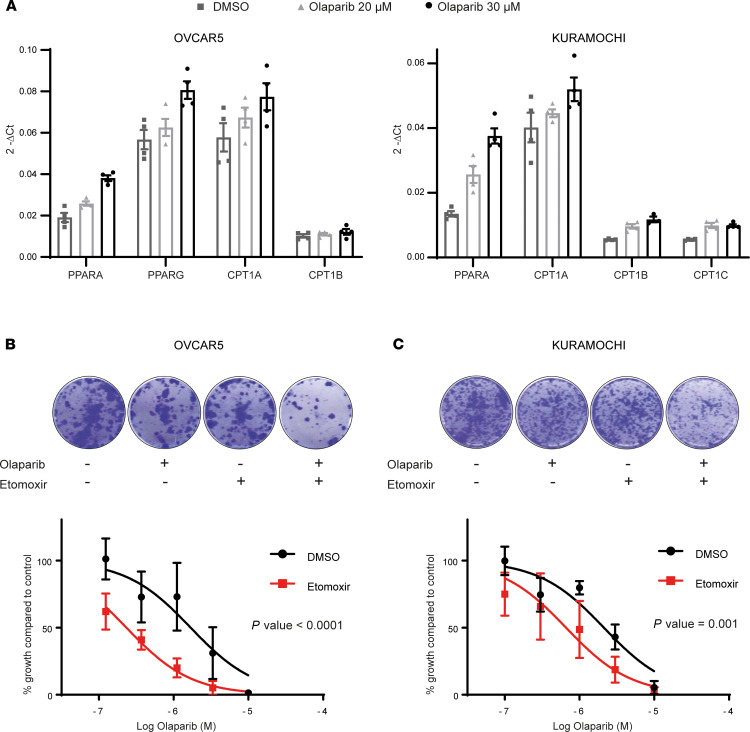
Figure 7. Inhibiting FAO enhances the cytotoxic effects of olaparib.
(A) Quantitative real-time PCR of lipid metabolism genes in OVCAR5 (left) and KURAMOCHI (right) cells treated with different concentrations of the PARP inhibitor olaparib. The graph represents 2-ΔCt of 4 technical replicates from n = 1. (B) Representative images from colony-forming assays of OVCAR5 cells treated with olaparib and 40 μM etomoxir (upper panel). Graph shows dose response to olaparib treatment with and without etomoxir (lower panel). A comparison of fits (F test) was performed on n = 3 independent experiments. (C) Representative images from colony-forming assays of KURAMOCHI cells treated with olaparib and 40 μM etomoxir (upper panel). Graph shows dose response to olaparib treatment with and without etomoxir (lower panel). A comparison of fits (F test) was performed on n = 3 independent experiments.

