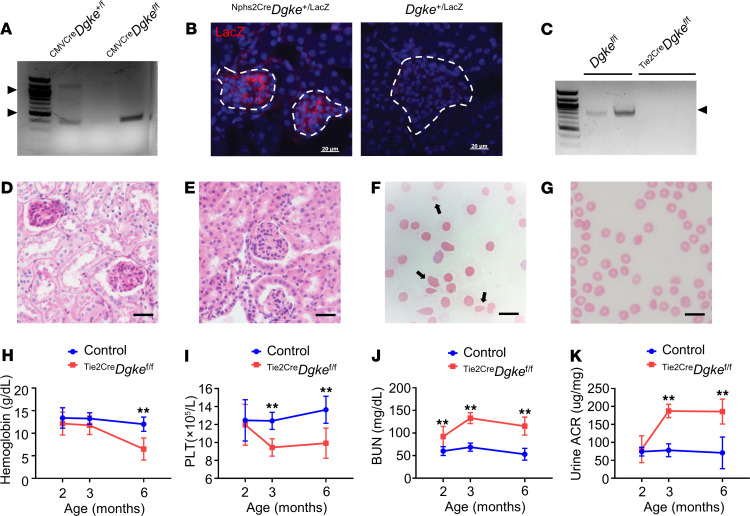
Figure 2. Endothelial specific Dgke-knockout mice recapitulate the full human phenotype.
(A) Agarose gel of the PCR products of the amplification of genomic DNA from ubiquitously Cre-expressing CMVCreDgkefl/fl mice compared with CMVCreDgke+/fl heterozygotes. Heterozygous mice show a long band of 1201 bp corresponding to the retained exon 2 and a shorter band of 365 bp corresponding to the excised exon 2 (arrowheads). Exon 2 is not retained in the homozygous status. (B) Immunofluorescence microscopy images of glomeruli (dashed lines) from Nphs2CreDgke+/LacZ knockin mice compared with Dgke+/LacZ controls, showing LacZ expression exclusively in glomeruli. Scale bars are 20 μm. (C) RT-PCR on RNA showing a band of 830 bp (arrowhead) in Dgkefl/fl mice and no product in Tie2CreDgkefl/fl mice. Primers were placed in the corresponding exon 1 and 5 in the cDNA of Dgke. (D) Representative bright-field microscopy images of glomeruli of Periodic acid–Schiff–stained (PAS-stained) and (E) H&E-stained sections of Tie2CreDgkefl/fl mouse kidneys showing near-complete occlusion of the capillary tuft. Scale bars are 50 μm. (F) Smears of blood from Tie2CreDgkefl/fl and (G) Dgkefl/fl controls at 6 months of age. Numerous schistocytes (arrows) are present in Tie2CreDgkefl/fl knockouts. Scale bars are 75 μm. (H–K) Serum hemoglobin, circulating platelets (PLT), blood urea nitrogen (BUN), and urine albumin to creatinine ratio (ACR) in Tie2CreDgkefl/fl compared with Dgkefl/fl controls at 2, 3, and 6 months of age. Data are presented as mean ± SD. **: P < 0.01 by Student’s t test. n = 6 mice per group.

