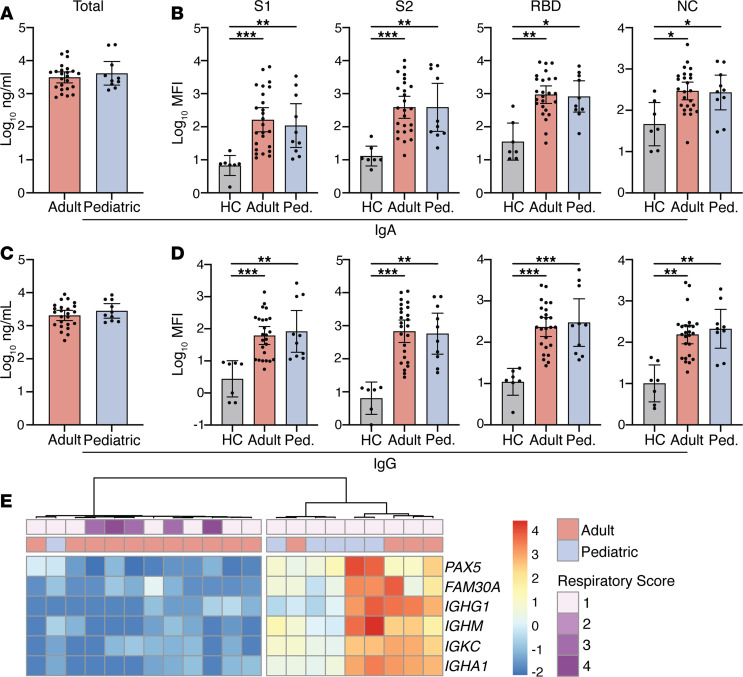
Figure 3. Early mucosal antibody responses in pediatric and adult COVID-19 patients.
(A) Total and (B) SARS-CoV-2–specific IgA and (C) total and (D) SARS-CoV-2–specific IgG levels at time of presentation were measured in 10 pediatric and 25 adult patients and 7 healthy controls (HCs). (E) Heatmap showing expression of B cell–related genes contributing to PC1-3. Annotations show age group and peak respiratory score (1 = room air, 2–4 = supplemental oxygen). Total antibody levels (A and C) measured by ELISA; SARS-CoV-2 antibody levels (B and D) measured by multiplexed Luminex assay. Where significant, P values are listed above comparison bars; Kruskal-Wallis test (B and D). Bars show mean ± 95% CI. *P < 0.05; **P < 0.01; ***P < 0.001. Ped., pediatric.

