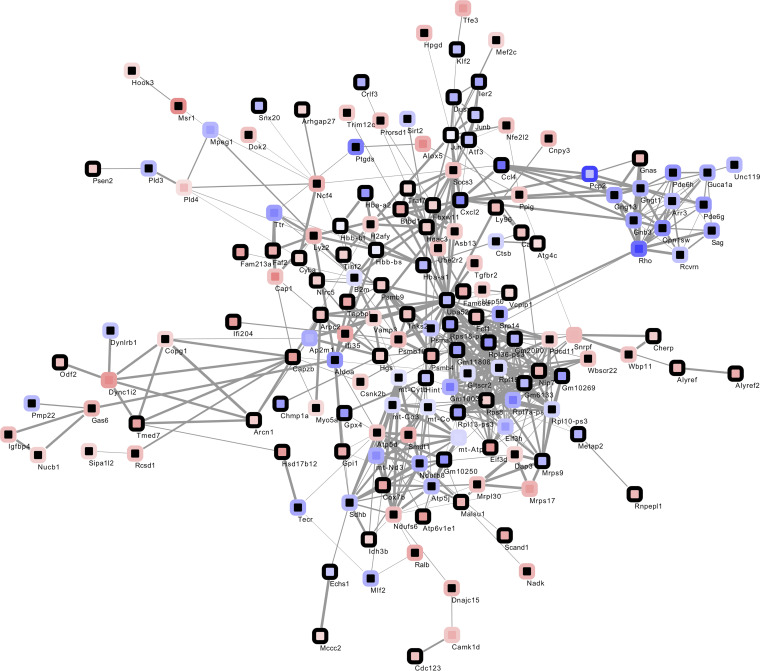
Figure 3. Interaction network of transcripts showing changed expression at 6 dpi (center) or 25 dpi (rim) compared with baseline.
Node color mapped continuously dependent on logFC from blue for reduced expression (6 dpi, logFC –1.92; 25 dpi, logFC –2.78) to red for enhanced expression (6 dpi, logFC 1.92; 25 dpi, logFC 2.78); black signifies absence of significant change at respective time point. Edge widths mapped continuously by interaction score from 0.4 (minimal width) to 1 (maximal width).

