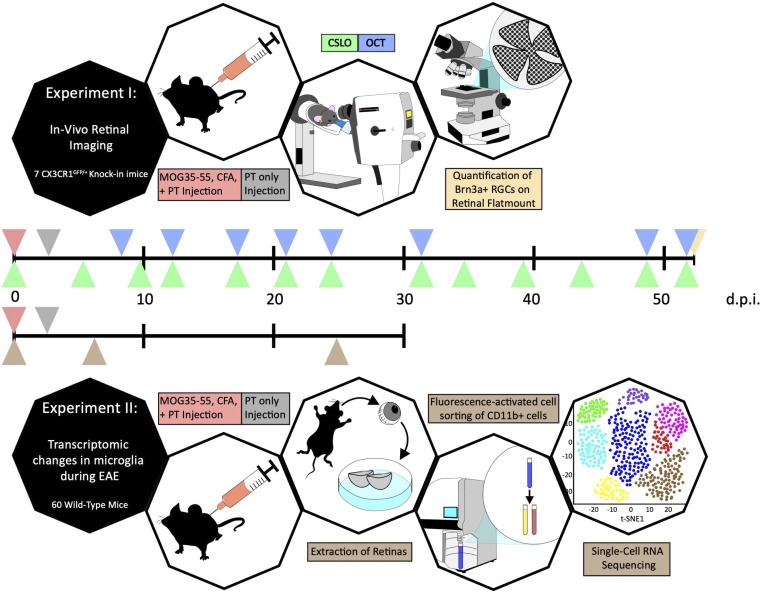
Figure 4. Experimental design.
Timelines for experiment I (first row) and experiment II (second row) with color-coded triangles marking time points for MOG35–55, CFA, and pertussis toxin (PT) injection (red), PT injection (gray), CSLO imaging (green), OCT imaging (blue), quantification of retinal ganglion cells on flatmounts (yellow), and extraction of retina for FACS and scRNA-seq analyses (brown).

