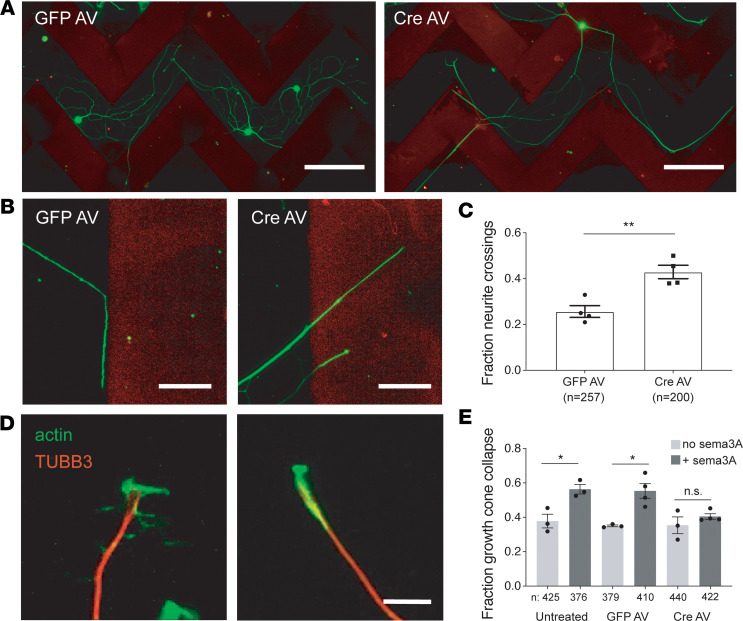
Figure 3. FL2 depletion attenuates the effects of inhibitory substrates on adult DRG GC advancement during regeneration.
(A) Micrographs of GFP AV– and Cre AV–treated neurons immunostained for TUBB3 (green) 72 hours after plating on aggrecan stripes (red). Scale bar: 200 μm. (B) High-magnification image of a GFP AV–treated neurite turning in response to an aggrecan border and Cre AV–treated neurites crossing through the stripe border. Scale bar: 50 μm. (C) Fraction of neurites of GFP AV– and Cre AV–treated neurons that crossed aggrecan stripe borders (GFP AV mean = 0.26 ± 0.026; Cre AV mean = 0.41 ± 0.06. P = 0.0169, unpaired 2-tailed Welch’s t test, GFP n = 65 neurons, 257 neurite/border encounters; Cre AV n = 79 neurons, 200 neurite/border encounters. Experiment performed 4 times). (D) Immuno-micrographs showing an active, viable GC (left) and a collapsed GC (right), stained for MTs (TUBB3) in red and actin in green. Scale bar: 10 μm. (E) Fraction of collapsed GCs in untreated, GFP AV–treated, and Cre AV–treated neurons, in the presence and absence of Sema3A. GFP and Cre AV experiments performed in quadruplicate, untreated +/– Sema3A performed in triplicate (untreated, no Sema3A: 0.38 ± 0.04, n = 425 GCs; untreated, +Sema3A: 0.56 ± 0.03, n = 376; GFP AV, no Sema3A: 0.35 ± 0.01, n = 379; GFP AV, +Sema3A: 0.55 ± 0.04, n = 410; Cre AV, no Sema3A: 0.35 ± 0.05, n = 440; Cre AV, +Sema3A: 0.40 ± 0.02, n = 422. Mean ± SEM; *P < 0.05, **P < 0.01; unpaired 2-tailed Welch’s t test). Imaging and analyses performed in a blinded manner.

