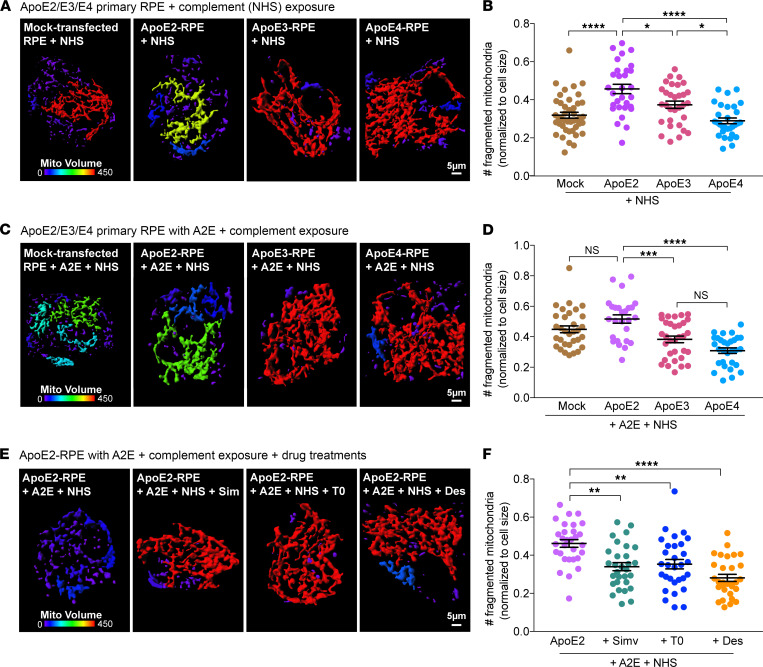
Figure 3. ApoE2 exacerbates complement-induced mitochondrial fragmentation in the RPE.
(A) 3D reconstruction of mitochondrial volumes from live imaging of MitoTracker in mock-transfected RPE or RPE expressing mCherry-tagged ApoE2, ApoE3, or ApoE4 exposed to 10% NHS to induce complement attack. Cooler colors in the color bar indicate increasing mitochondrial fragmentation. (B) Number of fragmented mitochondria after NHS exposure. (C) Mitochondrial volumes as in A in RPE treated with A2E prior to NHS exposure. (D) Quantification of mitochondrial fragments as in B. (E) Mitochondrial volumes as in A in ApoE2-expressing RPE with A2E exposed to NHS and treated with simvastatin (5 μM, 16 h), T0901317 (1 μM, 16 h), or desipramine (10 μM, 3 h) prior to imaging. (F) Quantification of mitochondrial fragments as in B. Mean ± SEM, *P < 0.05, **P < 0.005, ***P < 0.0005, ****P < 0.0001. n = 30 cells (A), 26 cells (B), and 30 cells (C) per condition; 1-way ANOVA with Bonferroni’s posttest. See also Supplemental Figure 3.

