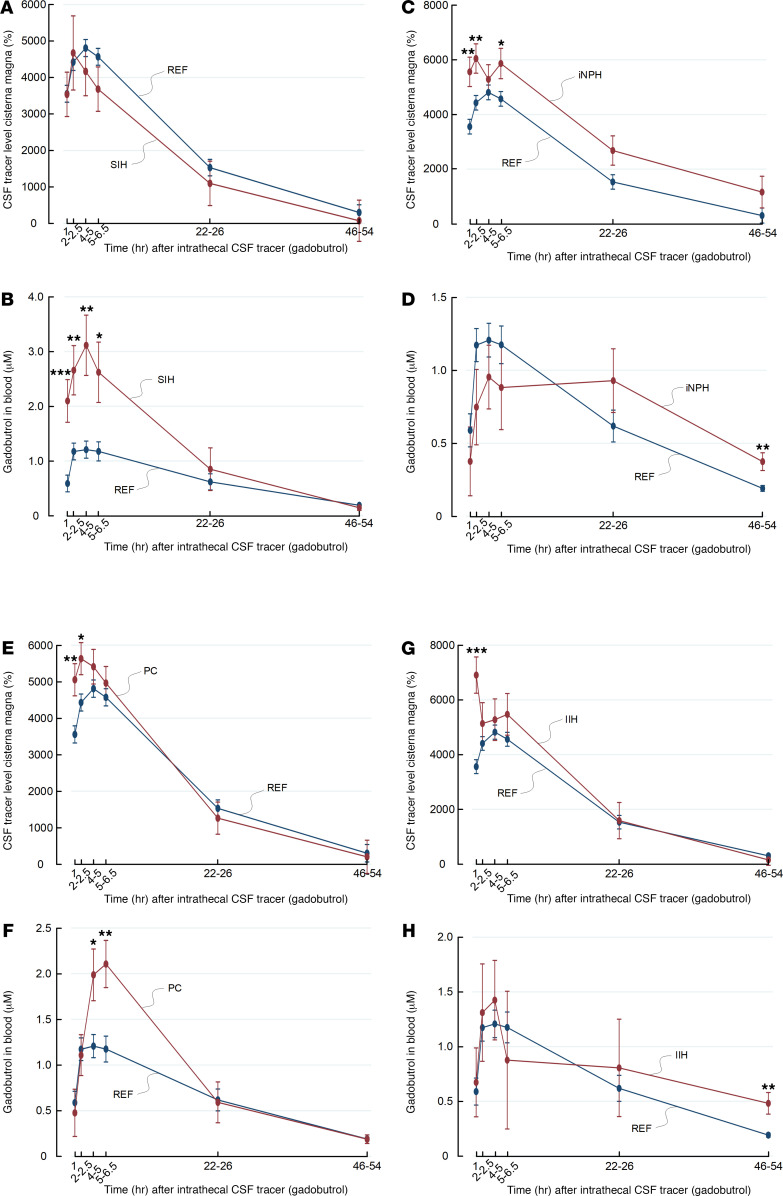
Figure 3. Trend plots of tracer levels in cisterna magna as assessed by MRI and in blood for different patient cohorts.
Enrichment of tracer in CSF of cisterna magna is shown as trend plot of percentage change in MRI signal unit ratio for (A) reference cohort (REF) (blue) and subjects with spontaneous intracranial hypotension (SIH) (red), (C) REF (blue) and individuals with idiopathic normal pressure hydrocephalus (iNPH) (red) individuals, (E) REF (blue) subjects and individuals with pineal cyst (PC) (red), and (G) REF (blue) and individuals with IIH (red). Tracer cleared from CSF to blood is presented as concentrations of gadobutrol in whole blood for (B) REF and subjects with SIH, (D) REF individuals and patients with iNPH, (F) REF individuals and patients with PC, and (H) REF individuals and patients with IIH. Trend plots are shown as mean ± SEM, estimated from the linear-mixed model of repeated measurements. *P < 0.05, **P < 0.01, ***P < 0.001.

