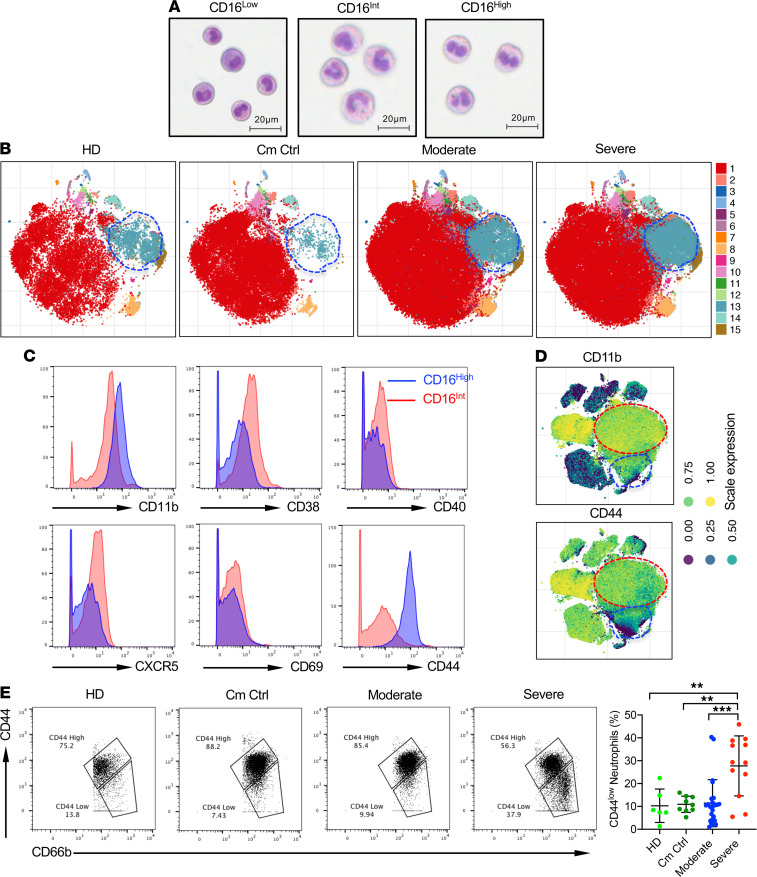
Figure 2. Phenotypic characteristics of neutrophil populations.
(A) Wright-Giemsa staining of sorted CD66b+ CD16Neg (left), CD16Int (middle), and CD16hi (right) populations show different stages of neutrophil maturation. (B) Representative cluster maps of CD66b+ neutrophil subsets in moderate and severe COVID-19 patients compared with Cm Ctrl and HD groups. (C) Representative histograms showing indicated surface molecule expression levels on CD16hi (blue) and CD16Int (red) LDNs. Cells were gated on the viable CD66b+ population. (D) viSNE cluster plots highlight the expression of CD11b and CD44 in the CD16Int (blue circle) and CD16hi (red circle) neutrophil populations. (E) Using mass cytometry, CD44 expression on CD66b+ neutrophils from HD (n = 6), Cm Ctrl (n = 9), and moderate (n = 24) and severe (n = 12) COVID-19 patients is shown. Representative dot plots and summarized data are shown. Data are presented as mean ± SD. P values were determined using 1-way ANOVA with multiple comparisons. **P < 0.01, ***P < 0.001.

