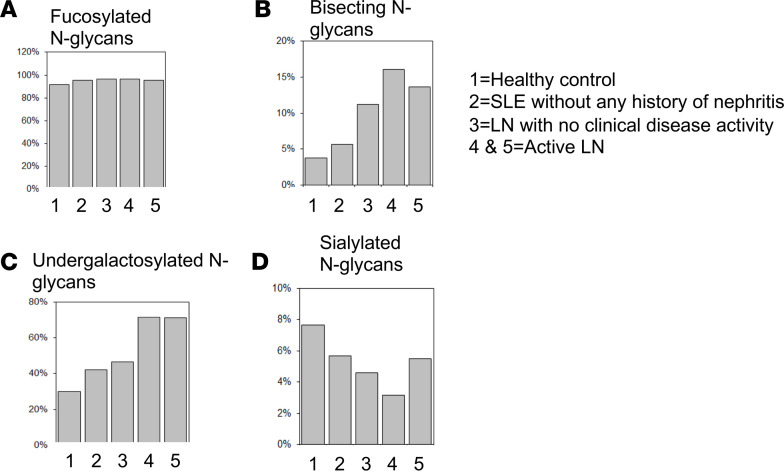
Figure 3. The IgG N-glycome in individuals with active LN differs from healthy controls and SLE patients without kidney disease.
Mass spectrometric quantification analysis of IgG from healthy controls (1), SLE patient with no kidney involvement (2), SLE patient with LN in remission (3), and SLE patients with active LN (4 and 5). Fucosylated N glycans (A), bissected N-glycans (B), undergalactosylated N glycans (C), and sialylated N glycans (D) (n = 5).

