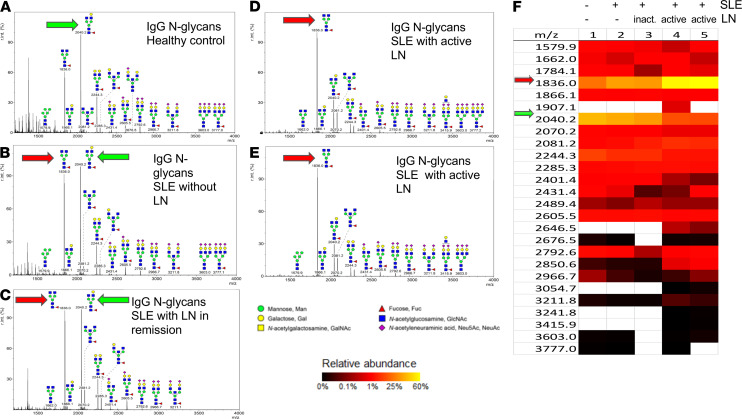
Figure 4. IgG from individuals with active LN is undergalactosylated compared with IgG from healthy controls and individuals with SLE without kidney disease.
(A–E) Representative images of mass spectrometric analysis of IgG from: healthy subject (A), SLE patient with no kidney involvement (B), SLE patient with LN in remission (C), SLE patient with active LN (D and E). (F) Heatmap displaying glycan moieties of different masses for each sample. Red arrow represents the glycan most prevalent in active LN, while green arrow indicates the glycan most prevalent in healthy controls (n = 5).

