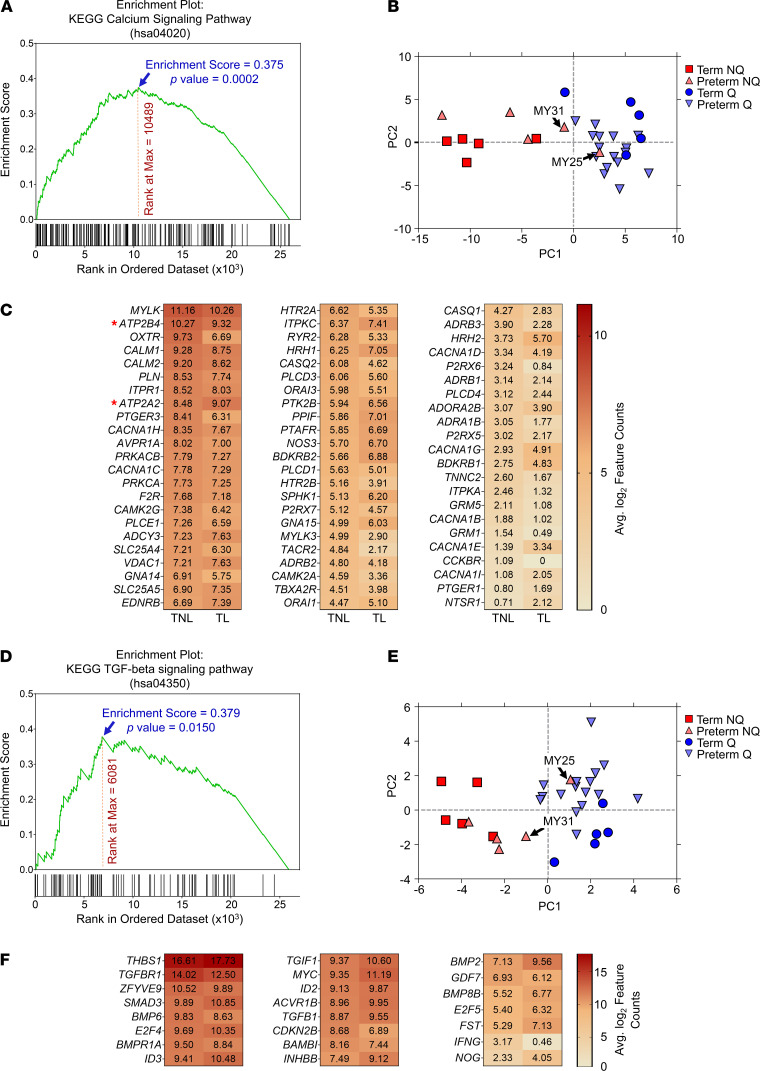
Figure 4. Myometrial nonquiescence is associated with potential dysregulation of Ca2+ signaling and TGF-β pathways.
(A) Gene set enrichment plot for the 183 transcripts related to the KEGG calcium signaling pathway. For this analysis, gene expression ranking in the TL versus TNL comparison was done by the adjusted P value (FDR) as determined using the DESeq2 algorithm, and statistical enrichment for the gene set was determined using 1000 gene list permutations. (B) Scatterplot of the top 2 principal components following dimensionality reduction of differentially abundant calcium signaling transcripts. TNL specimens are indicated by blue circles, TL samples are indicated by red squares, and preterm NQ (nonquiescent phenotype) and Q (quiescent phenotype) specimens are depicted by light red and light blue triangles, respectively. (C) Heatmap of average, log2-transformed, normalized RNA-seq feature counts for the 68 calcium signaling transcripts exhibiting significant differences in abundance between the TL and TNL myometrial samples (FDR < 0.1, fold-change of at least ± 1.5). Asterisks denote the 2 mRNAs encoding calcium transporter proteins selected for more detailed analysis: ATP2B4 and ATP2A2. Note that a difference between 2 values, a – b, in the log2-transformed data corresponds to a linear difference of 2a – 2b. (D) Gene set enrichment plot for the 84 transcripts related to the TGF-β signaling KEGG pathway, conducted as described above. (E) Scatterplot of the dominant principal components following PCA applied to differentially abundant TGF-β pathway transcripts. Sample annotation is equivalent to that in B. (F) Heatmap of the average normalized RNA-seq feature counts (log2-scaled) for the 23 TGF-β pathway genes that differed significantly between the TL and TNL myometrial samples (FDR < 0.1, minimum fold-change ± 1.5).

