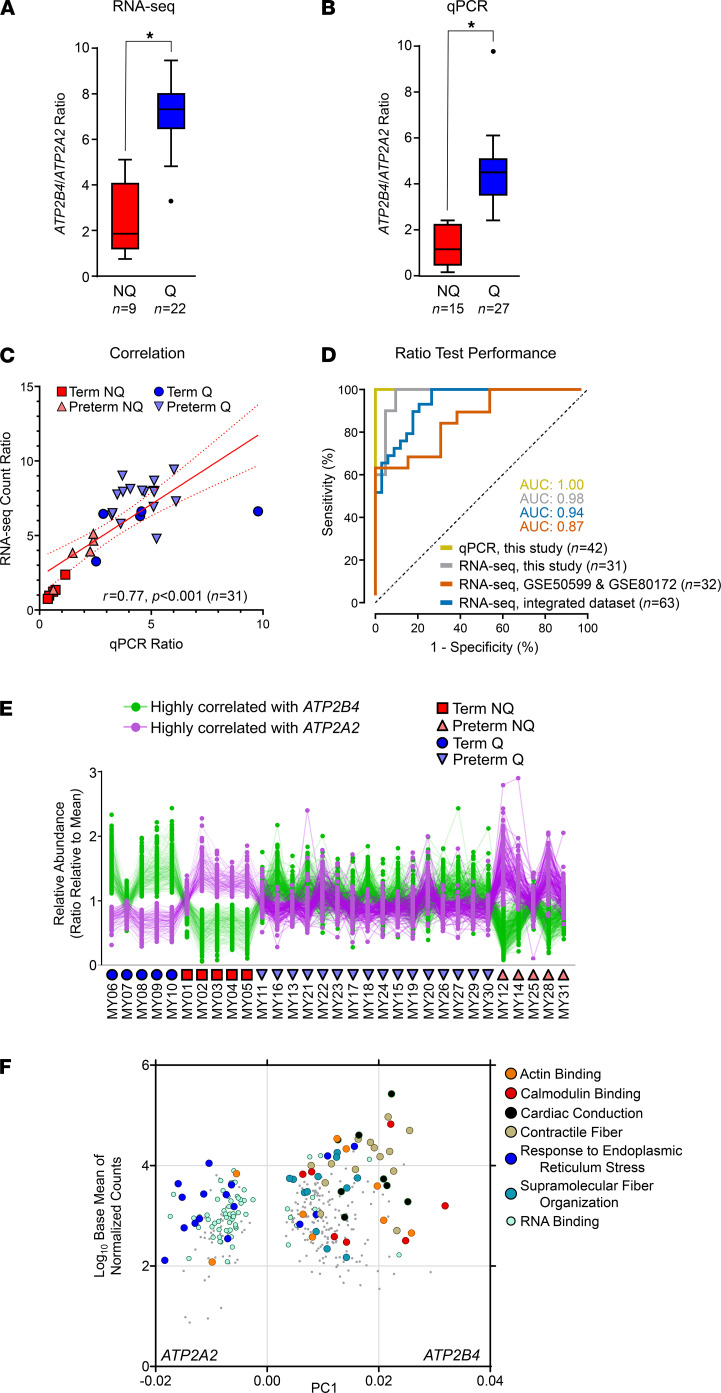
Figure 5. The expression ratio of 2 anticorrelated calcium transporter genes reliably distinguishes myometrial quiescence from the nonquiescent phenotype.
(A) Box and whisker plots (box, median with IQR; whiskers, inner fences using Tukey’s method) showing expression ratios of transcripts encoding ATP2B4 and ATP2B2 as determined by RNA-seq (Q, quiescent phenotype, n = 22; NQ, nonquiescent phenotype, n = 9). Asterisk indicates statistical significance (P < 0.001, Mann-Whitney U test). (B) Box and whisker plots (as in A) showing qPCR expression ratios of ATP2B4/ATP2B2, stratified by phenotype (Q, n = 27; NQ, n = 15). Asterisk indicates statistical significance (P < 0.001, Mann-Whitney U test). (C) Scatterplot showing the extent of correlation between ATP2B4/ATP2B2 expression ratios determined using RNA-seq and qPCR in 31 samples (r = 0.76, P < 0.001). TNL specimens are indicated by blue circles, TL samples are indicated by red squares, and preterm NQ and Q specimens are depicted by light red and light blue triangles, respectively. (D) ROC curve analysis applied to binary classification of NQ and Q specimens based on expression ratios of ATP2B4/ATP2B2 calculated either by qPCR (for samples from the current study) or RNA-seq (for samples from the current study, samples from prior published studies [GSE50599, n = 10; and GSE80172, n = 22], and an integrated data set comprising samples from the current study and the 2 existing data sets). All AUC values achieved statistical significance (P < 0.001). (E) Relative abundances of transcripts with expression highly correlated (r ≥ 0.95) with ATP2B4 (233 transcripts, green) or ATP2A2 (121 transcripts, purple). TNL specimens are indicated by blue circles, TL samples are indicated by red squares, and preterm NQ and Q specimens are depicted by light red and light blue triangles, respectively. (F) Overrepresented pathways for transcripts in E, plotted by average log10-scaled baseline expression in Q (term and preterm) specimens, and projection of transcript along PC1 in principle component analysis.

