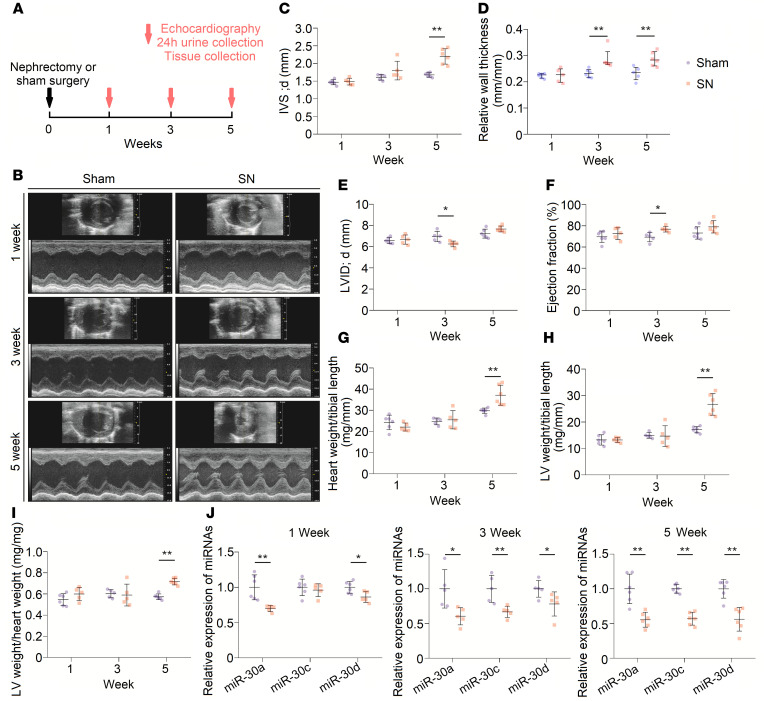
Figure 1. LVH gradually appears in SN rats.
(A) Schematic diagram for continuous observation in nephrectomized rats. (B) Representative short-axis echocardiography and M-mode images. (C and D) Diastolic interventricular septal thickness (IVS; d) and relative wall thickness of left ventricles gradually increase in nephrectomized rats. **P < 0.01 compared with values for the sham indicated by the dashed line, by 2-tailed, unpaired Student’s t test (C) and by Mann-Whitney U test (D). Data are shown as mean ± SD and median with interquartile range (C and D, respectively). n = 5 or 6 rats per group. (E) Diastolic LV internal diameter (LVID; d) decreases at 3 weeks after nephrectomy. *P < 0.05 compared with values for the sham indicated by the dashed line, by 2-tailed, unpaired Student’s t test. Data are shown as mean ± SD. n = 5 or 6 rats per group. (F) Nephrectomy leads to LV ejection fraction increase at 3 weeks after nephrectomy. *P < 0.05 compared with values for the sham indicated by the dashed line, by 2-tailed, unpaired Student’s t test. Data are shown as mean ± SD. n = 5 or 6 rats per group. (G–I) SN results in increase in heart weight/tibial length, LV weight/tibial length, and LV weight/heart weight ratios at 5 weeks after surgery. **P < 0.01 compared with values for the sham indicated by the dashed line, by 2-tailed, unpaired Student’s t test. Data are shown as mean ± SD. n = 5 or 6 rats per group. (J) Nephrectomy leads to downregulation of cardiac miR-30. Expression levels are normalized by U6. *P < 0.05 and **P < 0.01 compared with values for the sham indicated by the dashed line, by 2-tailed, unpaired Student’s t test. Data are shown as mean ± SD. n = 5 or 6 rats per group.

