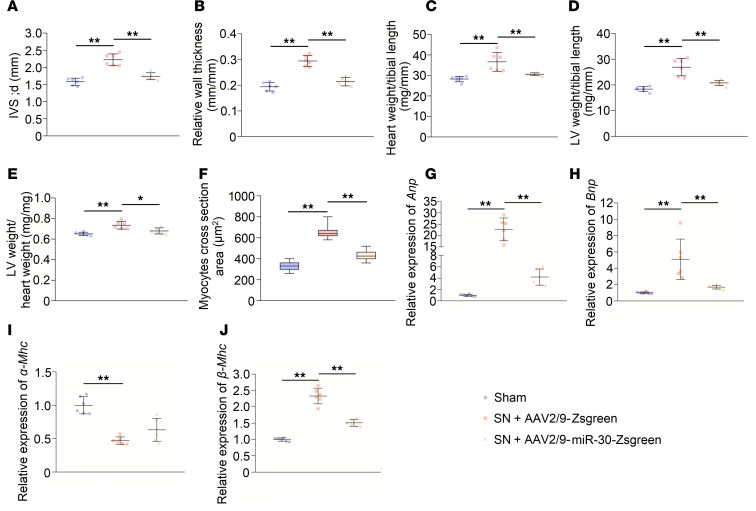
Figure 3. Cardiac miR-30 rescue mitigates CKD-induced LVH.
(A and B) miR-30 inhibits the IVS; d and relative wall thickness of LV increases in nephrectomized rats. **P < 0.01 compared with values indicated by the dashed line, by 1-way ANOVA test. Tukey’s multiple comparisons test was used for multiple comparison. Data are shown as mean ± SD. n = 6 rats per group. (C–E) miR-30 decreases heart weight/tibial length, LV weight/tibial length, and LV weight/heart weight ratios in SN rats. *P < 0.05 and **P < 0.01 compared with values indicated by the dashed line, by 1-way ANOVA test. Tukey’s multiple comparisons test was used for multiple comparison. Data are shown as mean ± SD. n = 6 rats per group. (F) MiR-30 suppresses increased cross-sectional area of cardiomyocytes in nephrectomized rats. **P < 0.01 compared with values indicated by the dashed line, by 1-way ANOVA test. Tukey’s multiple comparisons test was used for multiple comparison. Data are shown as median and quartiles, as well as the minimum and maximum values of the distribution. n = 360 cells per group. (G–J) miR-30 mitigates upregulated hypertrophic indicators in CKD rats, despite having no significant effect on α–myosin heavy chain (α-Mhc). Expression levels are normalized by 18S. **P < 0.01 compared with values indicated by the dashed line, by 1-way ANOVA test. Tukey’s multiple comparisons test was used for multiple comparison. Data are shown as mean ± SD. n = 6 rats per group.

