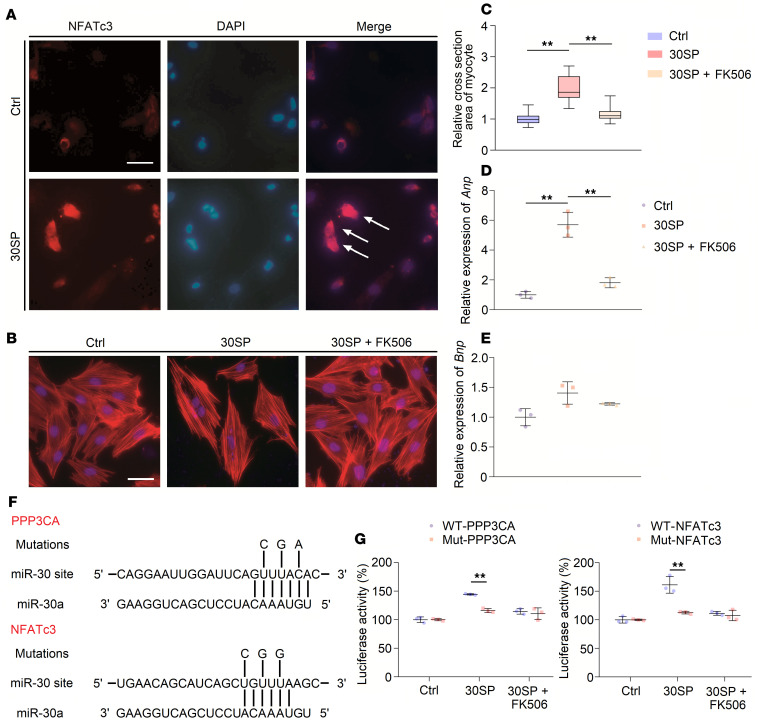
Figure 6. miR-30 knockdown induces cardiomyocyte hypertrophy via Calcineurin signaling.
(A) miR-30 sponge transfection into H9c2 cells leads to nuclear translocation of NFATc3. White arrows indicate NFATc3 gathers in nuclei (original magnification, ×400; scale bar: 50 nm). Ang II, angiotensin II; IS, indoxyl sulfate. (B and C) miR-30 sponge transfection results in H9c2 hypertrophy, and this effect is inhibited by FK506 (original magnification, ×400; scale bar: 50 nm). **P < 0.01 compared with values indicated by the dashed line, by 1-way ANOVA test. Tukey’s multiple comparisons test was used for multiple comparison. Data are shown as median and quartiles, as well as the minimum and maximum values of the distribution. n = 40 cells per group, in triplicated experiments. (D) miR-30 sponge transfection upregulates expression of Anp, while this can be suppressed by FK506. Expression levels are normalized by 18S. **P < 0.01 compared with values indicated by the dashed line, by 1-way ANOVA test. Tukey’s multiple comparisons test was used for multiple comparison. Data are shown as mean ± SD of 3 independent experiments. (E) miR-30 sponge transfection has no obvious effect in Bnp expression. Expression levels are normalized by 18S. Compared by 1-way ANOVA test. Tukey’s multiple comparisons test was used for multiple comparison. Data are shown as mean ± SD of 3 independent experiments. (F) Predicted miR-30a–targeted sites in the 3′-UTRs of Ppp3ca and NFATc3; mutations of 3 nucleotides as indicated are made for each mutant reporter construct. (G) The effects of miR-30 knockdown using the miR-30 sponge on luciferase reporter expression. **P < 0.01 compared with values indicated by the dashed line, by 2-tailed, unpaired Student’s t test. Data are shown as mean ± SD of 3 independent experiments.

