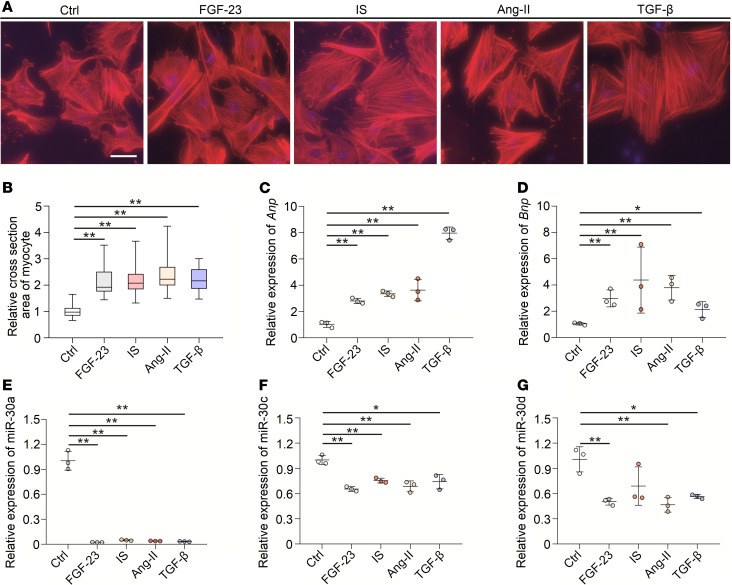
Figure 7. Hypertrophic stimuli suppress miR-30 expression in vitro.
(A) Representative fluorescein-conjugated phalloidin staining of the NRVMs (original magnification, ×400; scale bar: 50 nm). (B) Incubation of FGF-23, IS, Ang II, and TGF-β demonstrates prominent hypertrophy. **P < 0.01 compared with values indicated by the dashed line, by Kruskal-Wallis test. Dunn’s multiple comparisons test was used for multiple comparison. Data are shown as median and quartiles, as well as the minimum and maximum values of the distribution. n = 40 cells per group; in triplicated experiments. (C and D) FGF-23, IS, Ang II, and TGF-β upregulate Anp and Bnp in NRVMs. Expression levels are normalized by 18S. *P < 0.05 and **P < 0.01 compared with values indicated by the dashed line, by 1-way ANOVA test. Tukey’s multiple comparisons test was used for multiple comparison. Data are shown as mean ± SD of 3 independent experiments. (E–G) FGF-23, IS, Ang II, and TGF-β suppress miR-30 expression in NRVMs. Expression levels are normalized by U6. *P < 0.05 and **P < 0.01 compared with values indicated by the dashed line, by 1-way ANOVA test. Tukey’s multiple comparisons test was used for multiple comparison. Data are shown as mean ± SD of 3 independent experiments.

