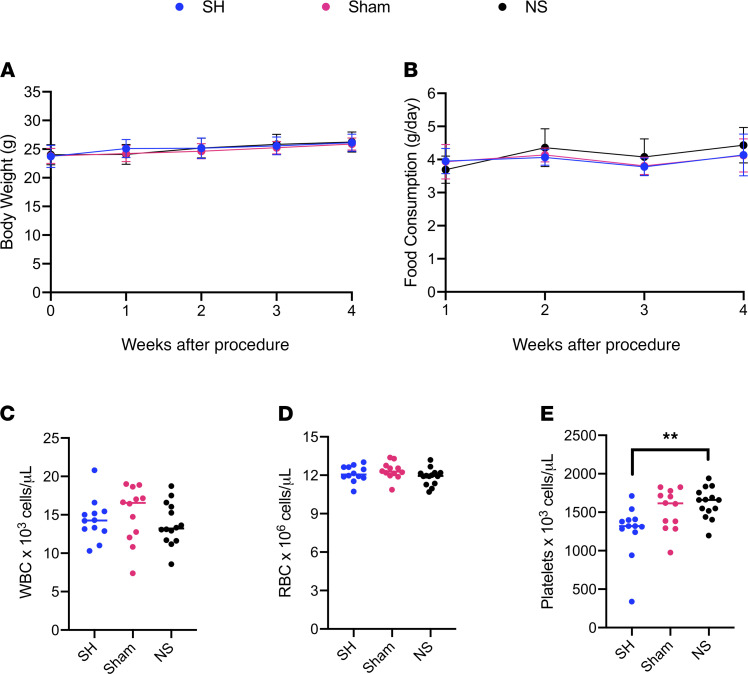
Figure 2. Health status monitoring of mice undergoing portal vein cannulation.
Portal vein cannulation was performed using saline-filled osmotic pumps (NS) and compared with sham procedure (Sham) and single-housed (SH) controls (n = 12–14 per group). (A) Body weights and (B) food consumption were measured weekly. (C) WBC, (D) RBC, and (E) platelet counts were measured 1 week after surgery. Statistical analysis of A and B was performed using a 1-way ANOVA with Tukey’s multiple comparisons test on the AUC and data are shown as the mean ± SEM. Statistical analysis of C–E was performed with 1-way ANOVA with Tukey’s multiple comparisons test. **P < 0.01.

