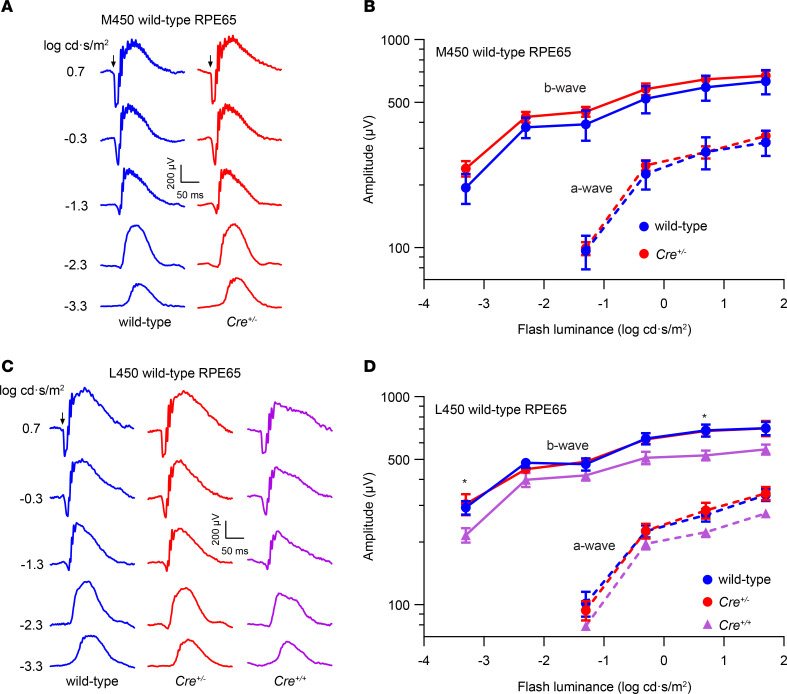
Figure 3. Impact of the KI allele on retinal function in Rpe65CreERT2 mice.
(A) Representative scotopic ERG waveforms from a PD30 wild-type mouse and a Cre+/– littermate harboring the M450 variant of wild-type RPE65. (B) Summary luminance-response functions for the dark-adapted ERG a-waves and b-waves in wild-type (M450 RPE65, n = 5) and Cre+/– (n = 9) littermates. Data points indicate the mean ± SEM. Two-way repeated measures ANOVA did not reveal a significant effect of genotype on either a-wave (F1,12 = 0.14, P = 0.72) or b-wave (F1,12 = 0.74, P = 0.41) response. (C) Representative scotopic ERG waveforms from a representative PD30 wild-type mouse and a Cre+/– littermate harboring L450 wild-type RPE65 as well as a Cre+/+ mouse with the same genetic background. (D) Summary luminance-response functions for the dark-adapted ERG a-waves and b-waves in wild-type (L450 RPE65, n = 6), Cre+/– (n = 4), and Cre+/+ (n = 8) littermates. Data points indicate the mean ± SEM. Two-way repeated measures ANOVA revealed a significant effect of genotype on b-wave response (F2,15 = 4.62, P = 0.03) and a borderline significant effect on a-wave response (F2,15 = 3.30, P = 0.07). Multiple comparisons tests using Tukey’s correction showed significant (*P < 0.05) differences between wild-type and Cre+/+ mice but no significant differences between wild-type and Cre+/– mice.

