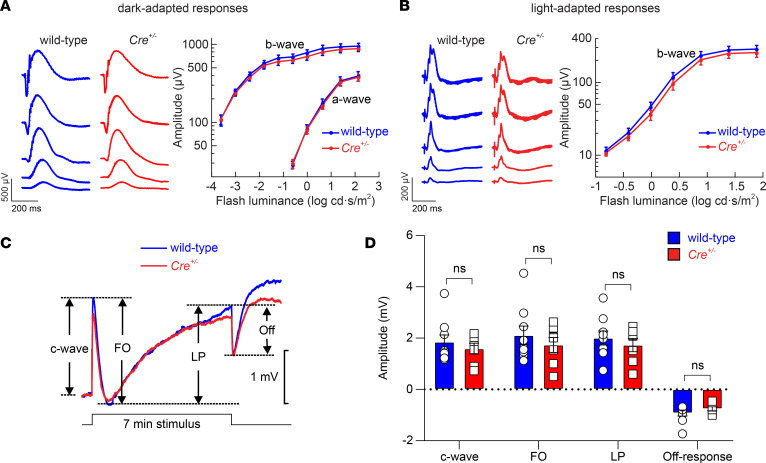
Figure 6. Impact of Cre induction on retinal and RPE function in Rpe65CreERT2 mice.
(A) Representative dark-adapted ERG waveforms (left) and average (± SEM) a-wave and b-wave amplitudes (right) for 4-month old Cre+/– mice (n = 7) or wild-type (M450 wild-type Rpe65) littermates (n = 9) that were administered the 5-day IP tamoxifen induction regimen starting on PD21. Two-way repeated measures ANOVA did not reveal a significant effect of genotype on either a-wave (F1,14 = 0.04, P = 0.84) or b-wave (F1,14 = 0.38, P = 0.55) amplitudes. (B) Representative light-adapted flash ERG waveforms (left) and average (± SEM) b-wave amplitudes (right) for 4-month old Cre+/– mice or wild-type littermates (same animals as in A that were administered the 5-day IP tamoxifen induction regimen on PD21). Two-way repeated measures ANOVA did not reveal a significant effect of genotype on b-wave responses (F1,14 = 0.40, P = 0.54). (C) Representative dc-ERG waveforms obtained from a Cre+/– mouse or a wild-type littermate in response to a 7-minute light stimulus. The main dc-ERG components are labeled on the graph. FO, fast oscillation; LP, light peak. (D) The amplitudes of the major dc-ERG components were not significantly different between wild-type mice (n = 9) and Cre+/– littermates (n = 7) as assessed by multivariate ANOVA: c-wave (F1,14 = 0.50, P = 0.49), FO (F1,14 = 0.61, P = 0.45), LP (F1,14 = 0.51, P = 0.49), and off-response (F1,14 = 1.25, P = 0.28). The same groups of mice were used for both standard and dc-ERG analyses. Each point represents data from a single mouse. Bars indicate mean ± SEM.

