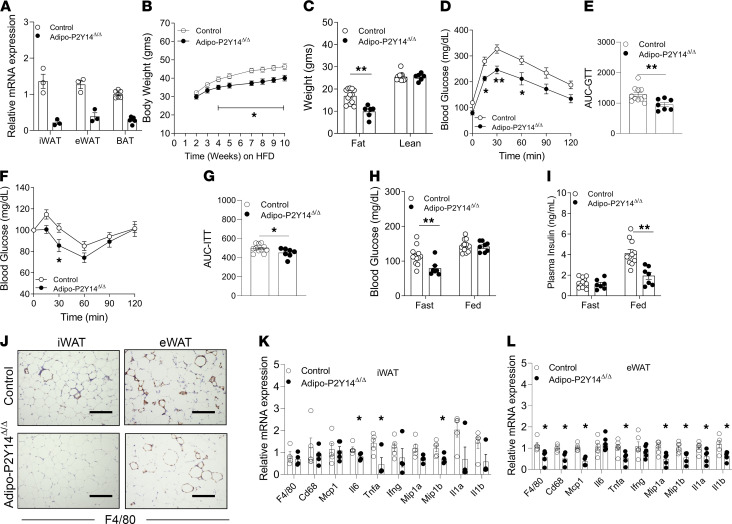
Figure 3. Adipocyte-specific P2Y14R KO mice (adipo-P2Y14Δ/Δ) are protected from DIO, inflammation and obesity-linked metabolic deficits.
(A) mRNA expression levels of P2Y14R in mature adipocytes isolated from iWAT (n = 3/group), eWAT (n = 3/group), and BAT (n = 5/group) of HFD adipo-P2Y14Δ/Δ and control mice. (B) Body weight measurements of mice maintained on HFD (n = 8 or 9/group). (C) Body composition (lean and fat mass) of mice maintained on HFD (n = 6–10/group). (D) GTT (1 g /kg glucose, i.p.) (n = 7–11/group). (E) AUC for D. (F) ITT (1 U/kg insulin, i.p.) (n = 7–11/group). (G) AUC for F. (H) Fasting and fed blood glucose levels (n = 7–11/group). (I) Fasting and fed plasma insulin levels (n = 7–11/group). (J) Representative F4/80-stained sections of iWAT and eWAT from HFD adipo-P2Y14Δ/Δ and control mice. (K) Relative mRNA expression levels of inflammatory genes in iWAT from HFD adipo-P2Y14Δ/Δ and control mice (n = 4 or 5/group). (L) Relative mRNA expression levels of inflammatory genes in eWAT from HFD adipo-P2Y14Δ/Δ and control mice (n = 4–6/group). The expression of 18s rRNA was used to normalize qRT-PCR data. All data are expressed as mean ± SEM. *P < 0.05, **P < 0.01 (A, C, E, and G–L: 2-tailed Student’s t test; B, D, and F: 2-way ANOVA followed by Bonferroni’s post hoc test). All experiments were conducted on mice maintained on an HFD for at least 8 weeks. Scale bar: 150 µm. P2Y, purinergic; DIO, diet-induced obesity; HFD, high-fat diet; GTT, glucose tolerance test; ITT, insulin tolerance test.

