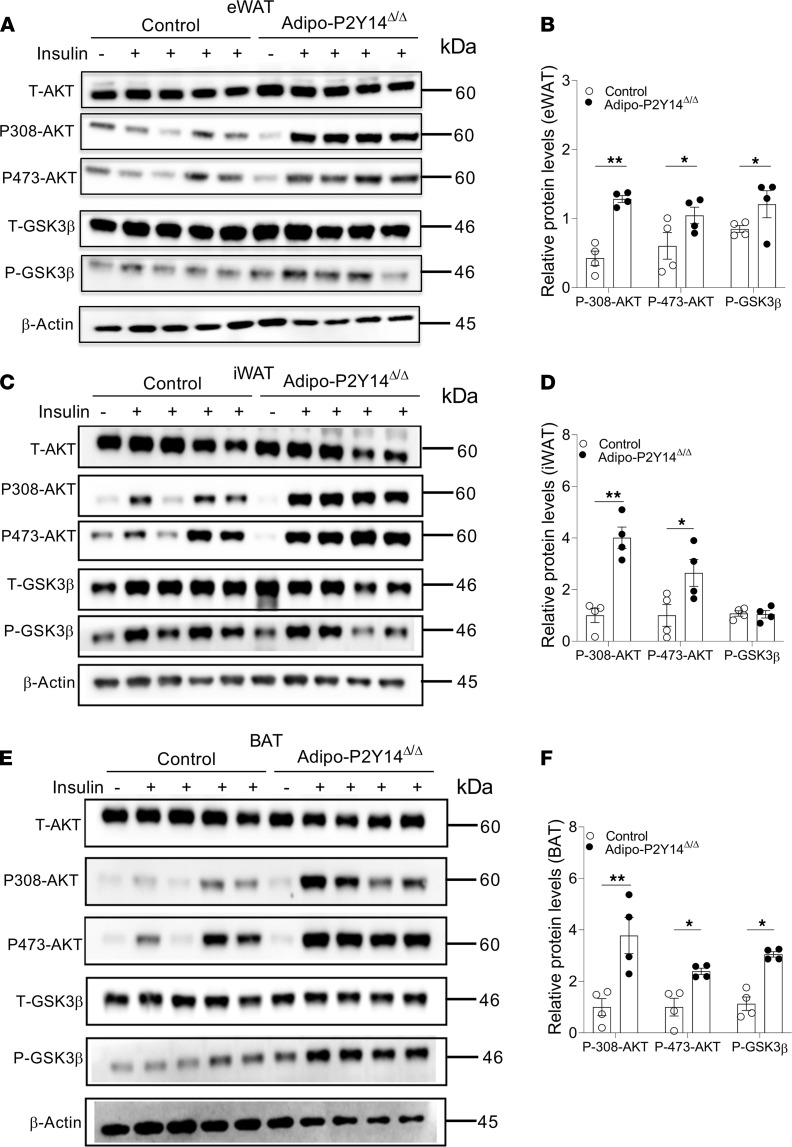
Figure 6. Adipo-P2Y14Δ/Δ mice show improved adipose insulin sensitivity.
(A) Western blot analysis of insulin signaling in eWAT of HFD adipo-P2Y14Δ/Δ and control mice (n = 4/group). (B) Quantification of immunoblotting data for A (n = 4/group). (C) Western blot analysis of insulin signaling in iWAT of HFD adipo-P2Y14Δ/Δ and control mice (n = 4/group). (D) Quantification of immunoblotting data for C (n = 4/group). (E) Western blot analysis of insulin signaling in BAT of HFD adipo-P2Y14Δ/Δ and control mice (n = 4/group). (F) Quantification of immunoblotting data for (E) (n = 4/group). All data are expressed as mean ± SEM. *P < 0.05, **P < 0.01 (2-tailed Student’s t test). All experiments were conducted on mice consuming an HFD for at least 8 weeks. P2Y, purinergic; HFD, high-fat diet.

