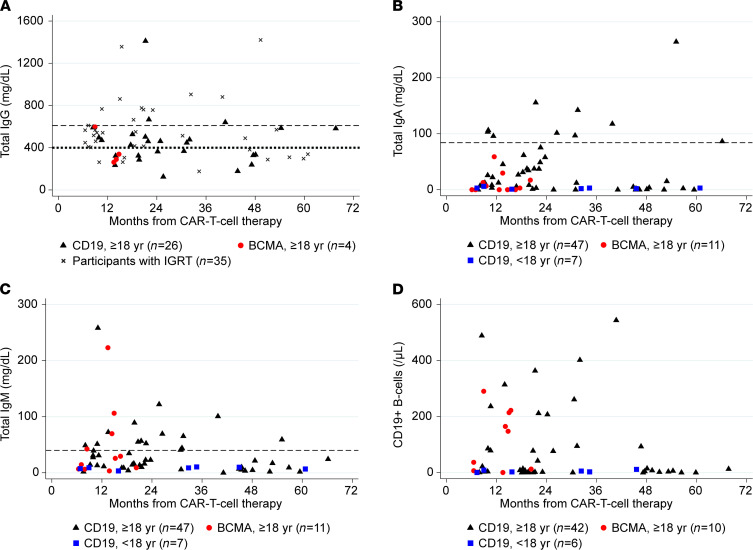
Figure 2. Total serum immunoglobulin levels and peripheral blood CD19+ B cell counts.
These scatterplots demonstrate (A) IgG levels, (B) IgA levels, (C) IgM levels, and (D) CD19+ B cell counts based on time after CAR-T cell therapy. Each symbol represents results from a single participant and provides information about CAR-T cell target and age; (A) also distinguishes between participants with and without IgG replacement therapy (IGRT) in the prior 16 weeks. The dashed horizontal line at 610 mg/dL illustrates the lower limit of normal (LLON). The dotted horizontal line at 400 mg/dL illustrates the level below which IGRT was recommended per institutional guidelines. Among those without IGRT, total IgG levels were below the LLON in 90% of participants and below 400 mg/dL in 47% of participants, and there was no correlation between total IgG and time after CAR-T cell infusion (Spearman’s r = –0.03). (B and C) The dashed horizontal lines represent the LLON for individuals ≥ 18 years old (84 mg/dL and 40 mg/dL, respectively). There was no significant correlation between serum total IgA or IgM and time after CAR-T cell infusion (Spearman’s r = –0.02 and –0.12, respectively). (D) CD19+ B cell counts among 58 participants with available results. There was no correlation between B cell count and time after CAR-T cell infusion (Spearman’s r = –0.11).

