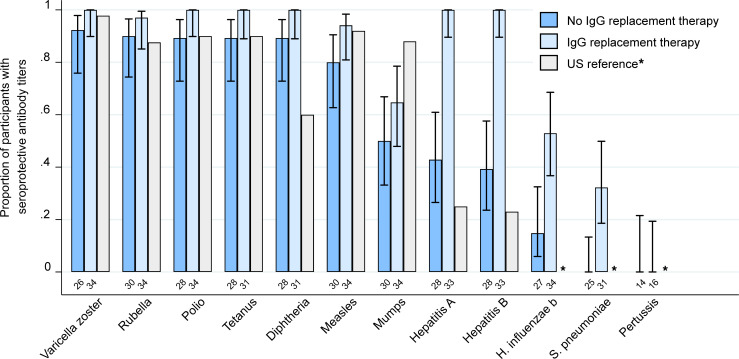
Figure 3. Proportion of CAR-T cell therapy recipients with seroprotective antibody titers against vaccine-preventable infections.
Bar graph showing the proportion of participants with seroprotective IgG titers for each vaccine-preventable infection, stratified by receipt of IGRT in the previous 16 weeks. Data from population-based studies in the United States are provided for comparison (22–27). US reference data were not available for H. influenza b, S. pneumoniae, and pertussis (indicated as *). Pertussis antibodies were only tested in the first testing batch of 31 participants based on negative results in all samples of the first batch. The total number of participants contributing data to each group are shown below the bars. Whiskers indicate the Wilson 95% confidence interval. Numerical results for participants who did not receive IGRT within the previous 16 weeks are provided in Supplemental Table 5.

