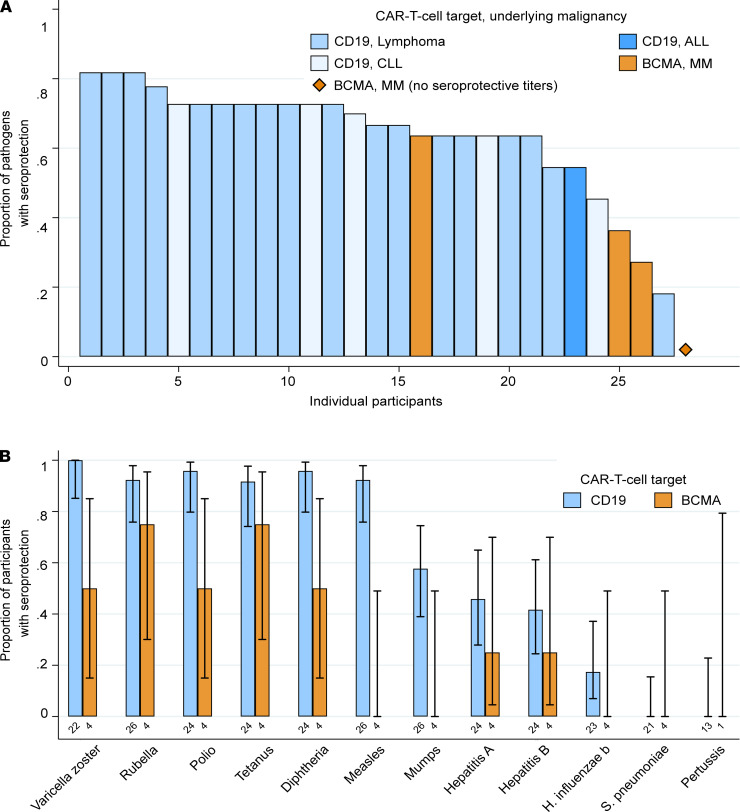
Figure 4. Seroprotective antibody titers stratified by CD19- versus BCMA-CAR-T cell therapy among 30 participants without IGRT in the previous 16 weeks.
(A) Bar chart showing the proportion of pathogens with seroprotective IgG titers per individual participant. Each bar represents a participant; 28 individuals with at least 6 valid test results are shown. Pertussis results were excluded from this analysis. One BCMA-CAR-T cell therapy recipient had no seroprotective titers. (B) Bar graph showing the proportion of participants with seroprotective IgG titers for each vaccine-preventable infection, stratified by CAR-T cell target. The total number of participants contributing data to each group are shown below the bars. Whiskers indicate the 95% confidence interval.

