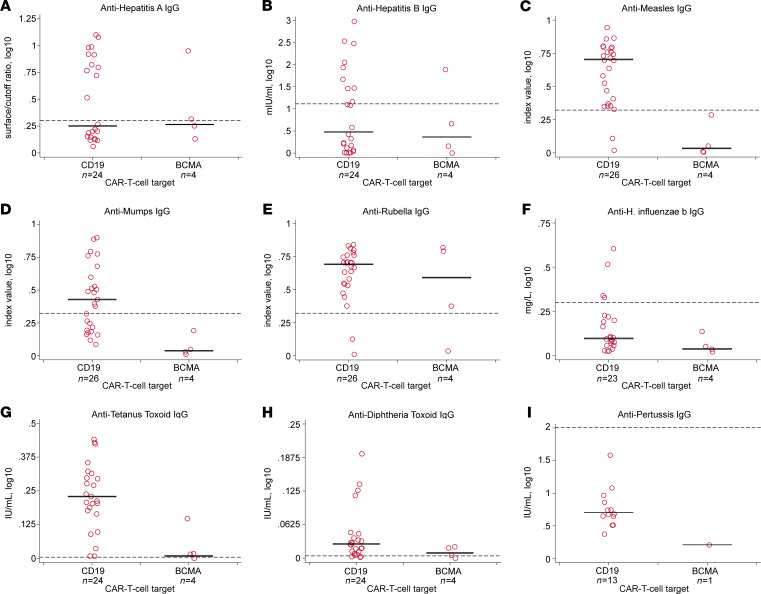
Figure 5. Absolute pathogen-specific IgG titers stratified by CD19- versus BCMA-CAR-T cell therapy among 30 participants without IGRT in the previous 16 weeks.
In panels A–I, solid black horizontal bars represent the median, and horizontal dashed reference lines represent the cutoff value for seroprotection. Each data point represents a participant. Exact numbers of participants providing results per pathogen are shown below the x axis labels, and number of participants with seroprotective antibody titers per pathogen is depicted in Supplemental Table 5. Anti-IgG values were transformed using log10(value+1). Varicella zoster and polio results are not provided because test results were not quantitative. Results for S. pneumoniae serotypes are provided in Supplemental Figure 5.

