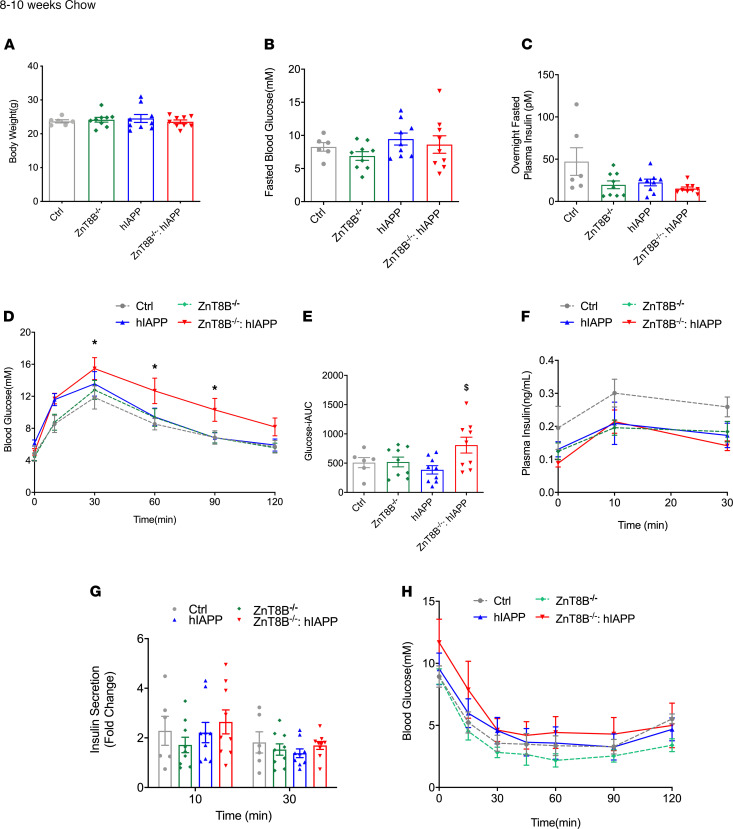
Figure 2. Chow-fed ZnT8B–/– hIAPP mice show significantly impaired glucose tolerance.
(A) Body weight, (B) 5-hour fasted blood glucose, (C) overnight fasted plasma insulin, (D) oral glucose tolerance test (OGTT), and (E) incremental area under the glucose curve (iAUC). (F) Plasma insulin during OGTT with (G) in vivo glucose-stimulated insulin secretion expressed as fold change over basal. (H) Insulin tolerance test (ITT). *P < 0.05, all groups compared with control. $P < 0.05, all groups compared with hIAPPs. Data are represented as mean ± SEM. (A–H) Control (n = 6), ZnT8B–/– (n = 9), hIAPP (n = 9), and ZnT8B–/– hIAPP (n = 9). One-way ANOVA with Tukey’s adjustment was used in A–C and E. Two-way ANOVA with Dunnett’s correction was used in D, F, G, and H.

