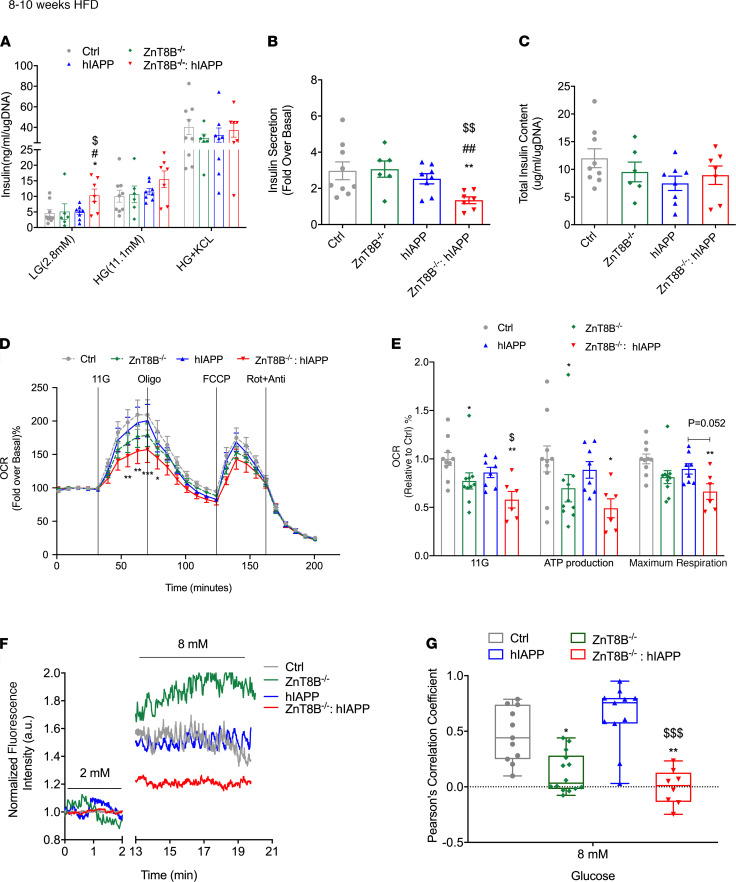
Figure 5. ZnT8B–/– hIAPP mice show impaired insulin secretion, glucose sensing, and cell synchronicity ex vivo.
(A) Glucose-stimulated insulin secretion from isolated islets with (B) glucose-stimulated insulin secretion expressed as fold change over basal, (C) total islet insulin content. (D) Oxygen consumption rate (OCR) measurement was acquired by Seahorse metabolic flux analyzer and (E) glucose-stimulated respiration and mitochondrial functional parameters were quantified as a fold change relative to controls. (F) Representative Ca2+ trace of control, ZnT8B–/–, hIAPP, and ZnT8B–/– hIAPP islet cells. Normalized regions of interest of the chosen cell’s cytoplasm to the mean of the time series, and calculated Pearson’s correlation coefficient of islet β cells synchronicity under 8 mM glucose-stimulated condition (G). Data are represented as mean ± SEM. (A–C) Control (n = 9), ZnT8B–/– (n = 6), hIAPP (n = 8), and ZnT8B–/– hIAPP (n = 7). (D and E) Control (n = 10), ZnT8B–/– (n = 10), hIAPP (n = 8), and ZnT8B–/– hIAPP (n = 6). (F and G) Two or 3 islets per mouse, and control (n = 6), ZnT8B–/– (n = 5), hIAPP (n = 6), and ZnT8B–/– hIAPP (n = 4). *P < 0.05, **P < 0.01, ***P < 0.001, all groups compared with control. #P < 0.05, ##P < 0.01, all compared with ZnT8B–/–. $P < 0.05, $$P < 0.01, $$$P < 0.001, all compared with hIAPP. One-way ANOVA with Tukey’s adjustment was used in A–C, E, and G. Two-way ANOVA with Dunnett’s correction was used in D.

