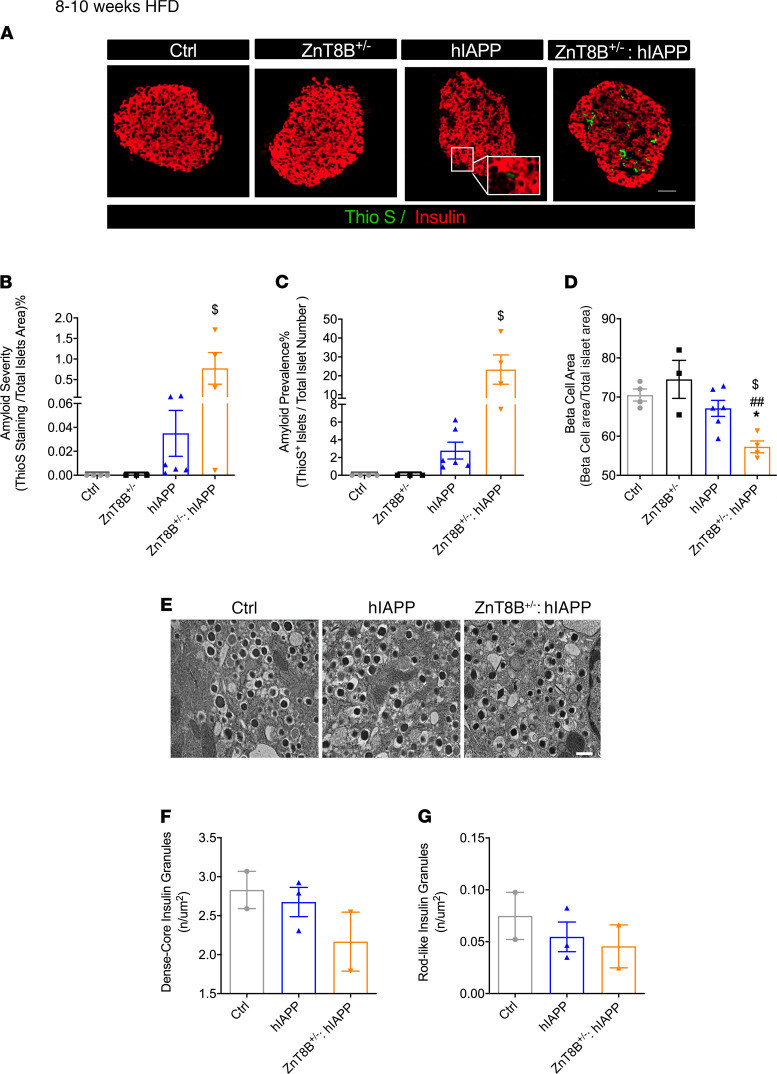
Figure 7. β Cell ZnT8 haploinsufficient hIAPP mice have increased islet amyloidogenesis and β cell loss but normal β cell morphology.
(A) Thioflavin S staining (scale bar: 50 μm) with quantification of (B) amyloid severity, (C) amyloid prevalence, and (D) β cell area. (E) Transmission electron microscopy on isolated islets (scale bar: 500 nm). (F) Quantifications of the number of dense-core granules and (G) rod-like insulin granules. Data are represented as mean ± SEM. (A–D) Control (n = 4), ZnT8B–/– (n = 3), hIAPP (n = 6), and ZnT8B–/– hIAPP (n = 4). (E and G) Control (n = 2), hIAPP (n = 3), and ZnT8B+/– × hIAPP (n = 2). *P < 0.05, all groups compared with control; ##P < 0.01, ZnT8B+/– hIAPP compared with ZnT8B+/–. $P < 0.01, ZnT8B+/– hIAPP compared with hIAPP. One-way ANOVA with Tukey’s adjustment was used in B–D, F, and G.

